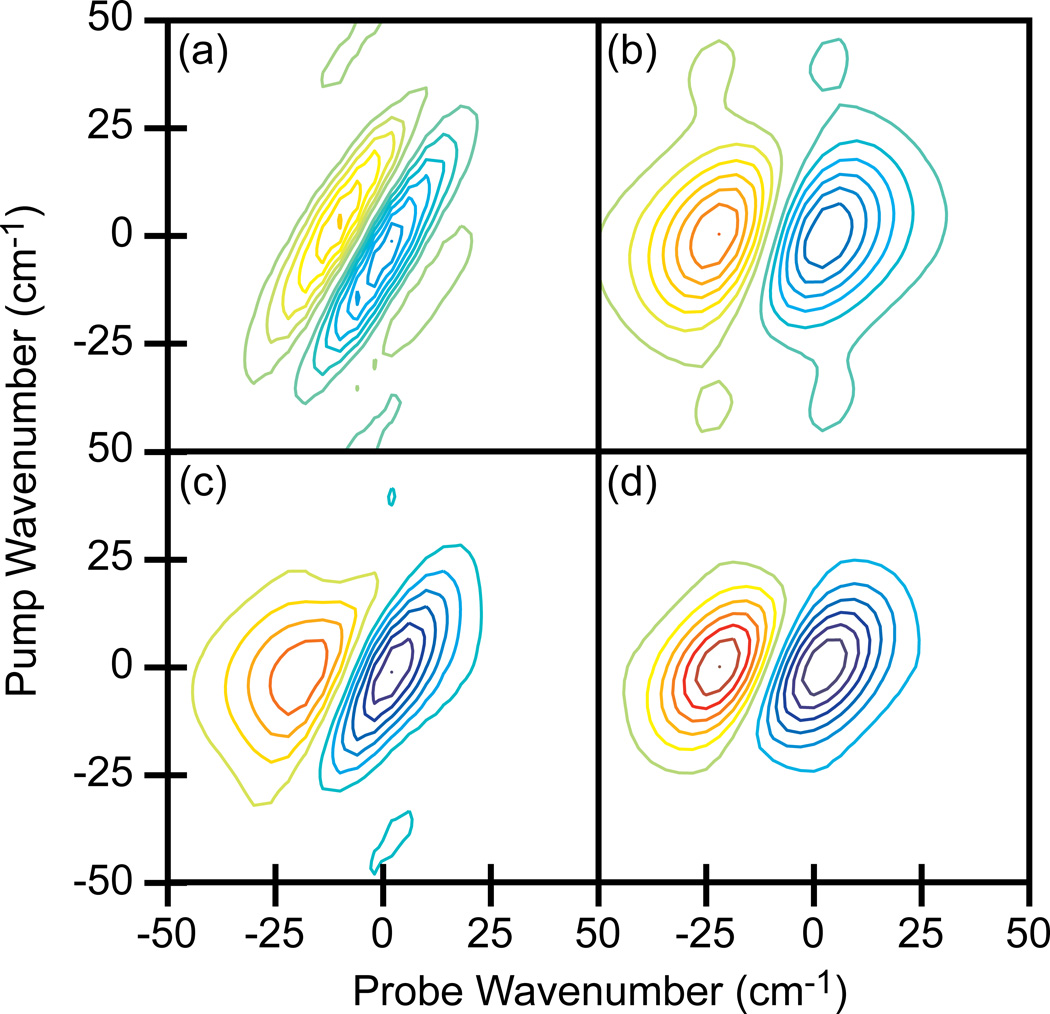
Figure 8.
Simulated 2D IR spectra of N-methylacetamide. (a) Spectrum generated when E3 acts before either E1 or E2. (b) Spectrum generated when E3 acts after both E1 and E2. (c) Summation of (a) and (b) which simulates the single pixel measurement. (d) Spectrum generated from only femtosecond pulses which simulates the data collected with the array. Spectra are plotted with the fundamental vibrational frequency set to 0 cm−1. Contours levels show 14% increments with zero level contours omitted.

