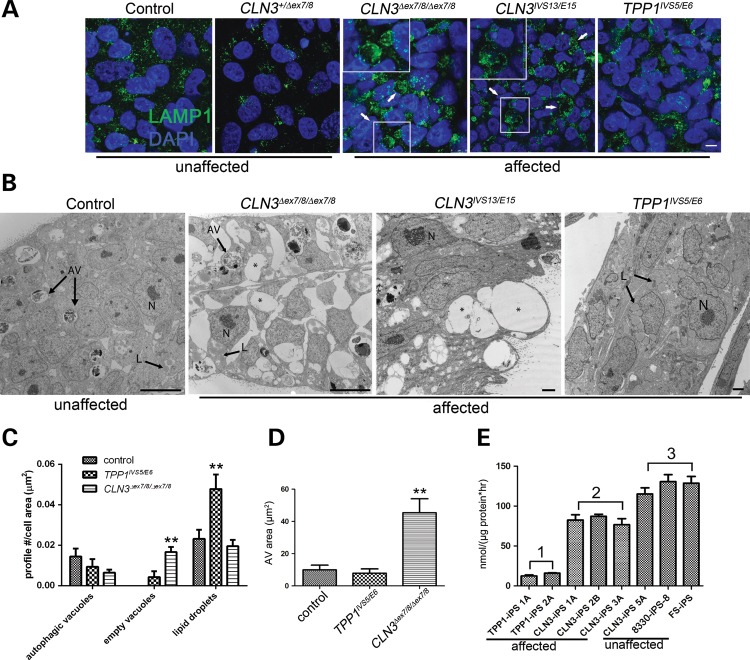
Figure 1.
TPP1 and CLN3 patient iPSCs show distinct pathology in lysosomal and autophagic compartments. (A) iPSC cells derived from control (unaffected) and patient (affected) fibroblasts were grown on Matrigel-coated cover slips and immunostained for lysosomal vesicles with LAMP1. Arrows and insets demonstrate enlarged LAMP1-positive vacuoles in two different representative CLN3 iPSC lines. Scale bar: 10 µm. (B) Representative TEM images of control (unaffected) and patient-derived (affected) iPSCs. N, nucleus; AV, degradative autophagic vacuoles; L, lipid droplets; asterisks, empty vacuoles. Scale bars: 10 nm (control and CLN3Δex7/8/Δex7/8), 2 nm (CLN3IVS13/E15 and TPP1IVS5/E6). (C) Quantification of structures demonstrated in (B). No significant difference was observed in the autophagic vacuole profile count per cell area (P > 0.05). Significantly more empty vacuoles were observed in CLN3Δex7/8/Δex7/8 cells (**P < 0.01), and significantly more cytoplasmic lipid droplets were observed in TPP1IVS5/E6 cells (**P < 0.01). Data are shown as mean ± SD. Similar qualitative patterns were observed in at least two additional iPSC lines each from TPP1 and CLN3-affected patients. (D) AV area measured for at least 20 representative degradative autophagic vacuoles per cell line, which were defined as described in Materials and Methods. **P < 0.01. (E) TPP1 enzyme activity in patient iPSC lines (affected), specifically TPP1 lines (Group 1) and CLN3 lines (Group 2), compared with control (unaffected) lines (Group 3; note that CLN3-iPS 5A is from a phenotypically normal donor heterozygous for the common CLN3Δex7/8 deletion). P < 0.01, Group 1 versus Groups 2 and 3. P < 0.05, Group 2 versus Group 3. Data are shown as mean ± SD of three technical replicates per line normalized to total protein.

