Figure 4.
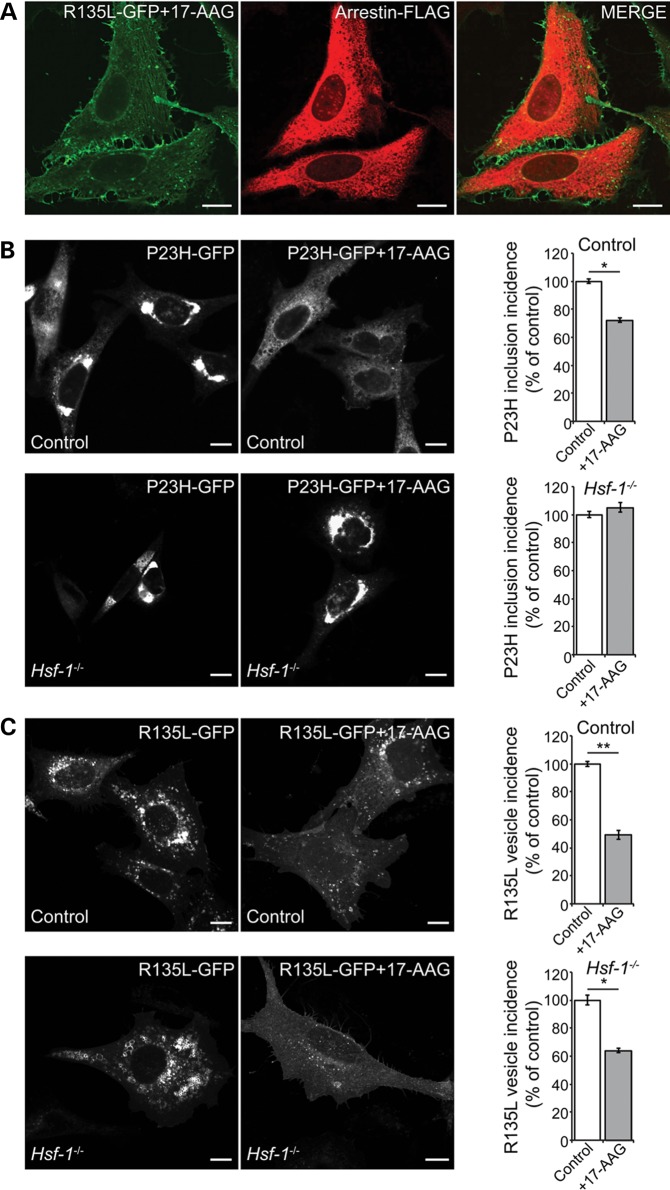
Hsp90 inhibition affects P23H and R135L by different mechanisms. (A) Subcellular distribution and trafficking of rod opsin in SK-N-SH cells co-transfected with R135L-GFP rod opsin (green) and arrestin-FLAG (red) and treated with 17-AAG (1 μm) for 24 h. (B) Representative images of P23H-GFP expressing control (upper panels) and Hsf-1−/− MEFs (lower panels) treated with vehicle or 17-AAG (0.5 μm) for 20 h as indicated (left panels). At least 600 cells were scored for the presence of inclusions in each condition and the inclusion incidence was normalized to vehicle-treated inclusion incidence (right panels). Values are mean ± SEM. *P < 0.05, Student’s t-test. (C) Representative images of R135L-GFP expressing control (upper panels) and Hsf-1−/− MEFs (lower panels) treated with vehicle or 17-AAG (0.5 μm) for 20 h, as indicated (left panels). Cells were scored for large intracellular accumulations of R135L-positive vesicles and the values normalized to vehicle-treated MEFs (right panels). At least 600 cells were scored in each condition. Values are mean ± SEM. *P < 0.05, **P < 0.01, Student’s t-test. Scale bars: 10 μm.

