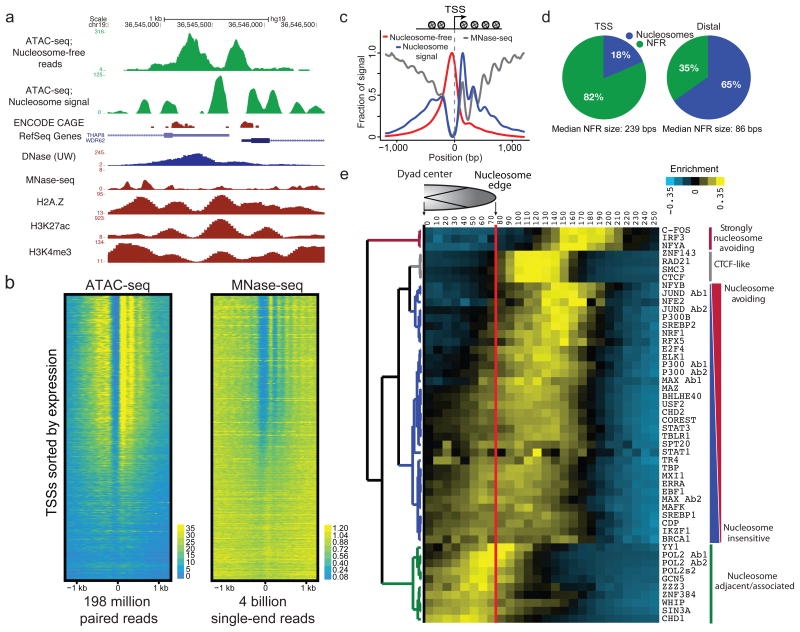
Figure 3. ATAC-seq provides genome-wide information on nucleosome positioning in regulatory regions.
(a) An example locus containing two transcription start sites (TSSs) showing nucleosome free read track, calculated nucleosome track (Methods), as well as DNase, MNase, and H3K27ac, H3K4me3, and H2A.Z tracks for comparison. (b) ATAC-seq (198 million paired reads) and MNase-seq (4 billion single-end reads from ref 23) nucleosome signal shown for all active TSSs (n=64,836), TSSs are sorted by CAGE expression. (c) TSSs are enriched for nucleosome free fragments, and show phased nucleosomes similar to those seen by MNase-seq at the −2, −1, +1, +2, +3 and +4 positions. (d) Relative fraction of nucleosome associated vs. nucleosome free (NFR) bases in TSS and distal sites (see Methods). (e) Hierarchical clustering of DNA binding factor position with respect to the nearest nucleosome dyad within accessible chromatin reveals distinct classes of DNA binding factors. Factors strongly associated with nucleosomes are enriched for chromatin remodelers.

