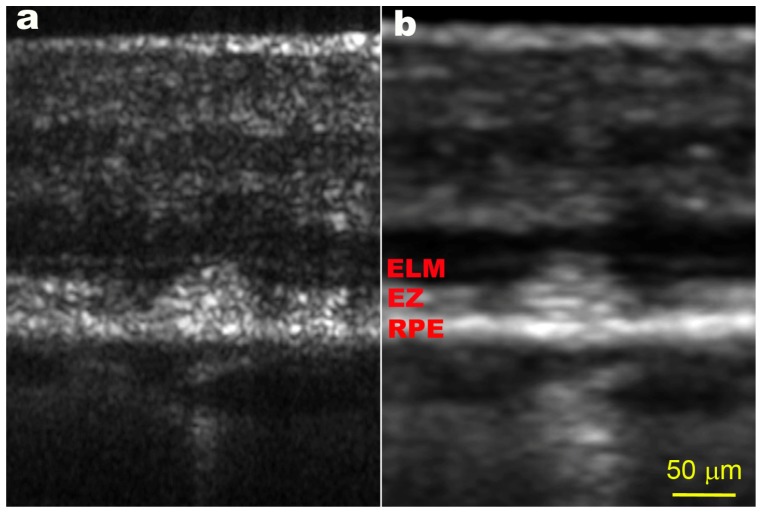
Fig. 8.
AO-OCT and SD-OCT of SDD. (a) AO-OCT scanned vertically across the SDD, as indicated by the red arrow line in Fig. 6. The red arrow points to the left side of panel a. (b) SD-OCT B-scan taken along the green arrow-line in Fig. 6. Both images show that this SDD has broken the EZ(IS/OS) band and expanded into the ELM band. The scale bar in panel b applies to both panels. SD-OCT is shown with logarithmic grey scale, whereas AO-OCT scan has a linear grey scale. AO-OCT scan is orthogonal to SD-OCT scan.

