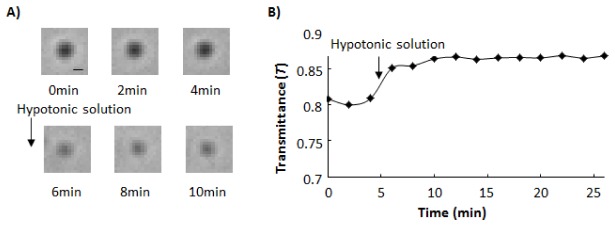
Fig. 5.

Time-course of changes in transmittance (T) at a mitochondrion. Hypotonic solution was added to mitochondria at t = 5 min. A) Sequential images of a single mitochondrion before and after addition of hypotonic solution. Time interval between each image was 2 min. Each image was obtained in the plane where Rplane showed the local minimum value. Bar, 1 μm. B) Time-course of changes in T at the single mitochondrion. Definitions of Rplane and T are written in “Methods” and “Results” section, respectively
