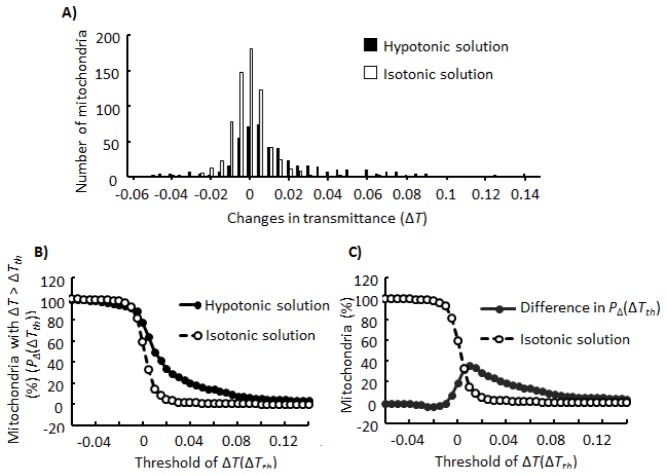
Fig. 6.
Distributions of ΔTs. A) Distributions of ΔTs upon addition of the hypotonic or isotonic solution. B) The percentage of mitochondria for which ΔTs are larger than ΔTth that is indicated on the horizontal axis (PΔ(ΔTth)). C) Difference between PΔ(ΔTth) upon addition of the hypotonic solution and PΔ(ΔTth) upon addition of isotonic solution (closed circles). Open circles indicate PΔ(ΔTth) upon addition of the isotonic solution. Definitions of ΔT, ΔTth, and PΔ(ΔTth) are described in the “Results” section.

