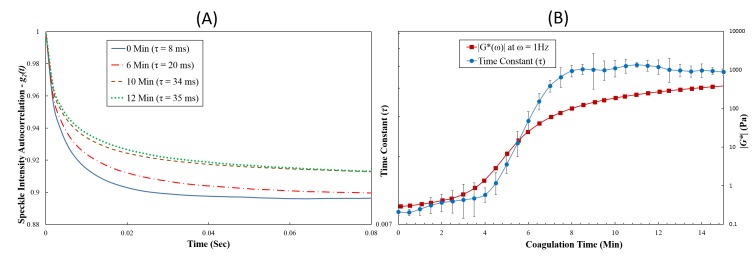
Fig. 2.
(A) Speckle intensity autocorrelation curve, g2(t), measured at 0, 6, 10, and 12 minutes during coagulation process from a human blood sample. It was observed that g2(t) decay slowed down as blood coagulation progressed. No significant change in the g2(t) decay trend was observed after completion of clot formation. Slower g2(t) decay and the corresponding increase in speckle autocorrelation time constant (τ) indicated an increase in clot viscoelastic modulus during coagulation process. (B) Speckle autocorrelation time constant, τ (primary y-axis), and the viscoelastic modulus |G*(ω)|ω = 1 Hz (secondary y-axis) plotted as a function of coagulation time for a human blood sample. Similar trends were observed for both the τ, and |G*| curves during coagulation. In each case, the average value of the three LSR τ-measurements is plotted and the error bars depict standard deviations.

