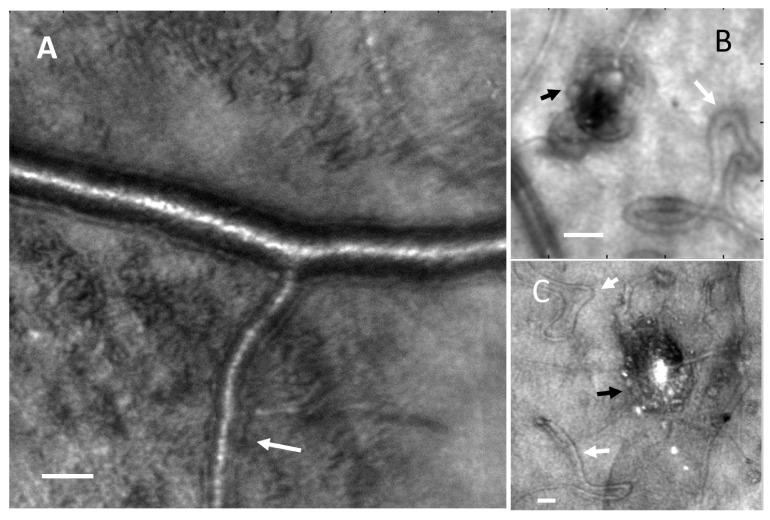
Fig. 6.
(A). AOSLO reflectance images showing thickened arteriole walls (white arrow) and widespread tissue changes (apparently roughened surface). Panel A is an image from the same region of the subject shown in Fig. 3. Scale bar = 50 μm. B, C microaneurysms and capillary remodeling including loops and hairpins. The layering of cells surrounding microaneurysms can be seen (black arrows) as well as capillary remodeling (white arrows). Scale bar = 25 μm.

