Abstract
Surgeries to correct nasal airway obstruction (NAO) often have less than desirable outcomes, partly due to the absence of an objective tool to select the most appropriate surgical approach for each patient. Computational fluid dynamics (CFD) models can be used to investigate nasal airflow, but variables need to be identified that can detect surgical changes and correlate with patient symptoms. CFD models were constructed from pre- and post-surgery computed tomography scans for 10 NAO patients showing no evidence of nasal cycling. Steady-state inspiratory airflow, nasal resistance, wall shear stress, and heat flux were computed for the main nasal cavity from nostrils to posterior nasal septum both bilaterally and unilaterally. Paired t-tests indicated that all CFD variables were significantly changed by surgery when calculated on the most obstructed side, and that airflow, nasal resistance, and heat flux were significantly changed bilaterally as well. Moderate linear correlations with patient-reported symptoms were found for airflow, heat flux, unilateral allocation of airflow, and unilateral nasal resistance as a fraction of bilateral nasal resistance when calculated on the most obstructed nasal side, suggesting that these variables may be useful for evaluating the efficacy of nasal surgery objectively. Similarity in the strengths of these correlations suggests that patient-reported symptoms may represent a constellation of effects and that these variables should be tracked concurrently during future virtual surgery planning.
Keywords: Numerical modeling, Nasal resistance, Nasal heat flux, Computational fluid dynamics, Patient symptoms
1. Introduction
Nasal airway obstruction (NAO) is a common affliction (Jessen and Malm, 1997). Surgeries to correct anatomic deformities contributing to NAO are often successful, but many such procedures have less desirable outcomes (Andre et al., 2006; Dinis and Haider, 2002; Illum, 1997; Singh et al., 2006). Studies investigating non-desirable outcomes have noted a lack of clinical tools providing consistent, objective measures of nasal physiology. In addition, difficulties correlating measurements with patient-reported symptoms indicate that new tools and measures are needed (Kjaergaard et al., 2008; Lam et al., 2006; Pawar et al., 2010; Rhee, 2009; Schumacher, 2002).
Computational fluid dynamics (CFD) is a tool that can fill this need. CFD modeling of nasal physiology has evolved from two-dimensional airflow simulations in simplified channels (Tarabichi and Fanous, 1993) to three-dimensional models of airflow, heat, water vapor, and inhaled material transport in anatomically-accurate reconstructions of the nasal passages based on medical images (Chen et al., 2009; Frank et al., 2013; Garcia et al., 2007; Kimbell et al., 2007; Lindemann et al., 2006; Rhee et al., 2012; Subramaniam et al., 1998; Wexler et al., 2005). Nasal CFD models can estimate many physiologically relevant variables in exquisite anatomical detail, and are the focus of an increasing number of studies (Leong et al., 2010; Wang et al., 2012).
For CFD to be useful to nasal surgeons, variables must be identified that reflect surgical changes and correlate with symptoms, e.g., feelings of congestion, blockage, breathing difficulties, sleep disturbance, and air hunger (Rhee and McMullin, 2008). Nasal resistance is affected by reduction in airway cross-sectional area and may relate to congestion and blockage. Abnormal patterns of airflow may disrupt normal sensation stimuli (Garcia et al., 2007) so that airflow and wall shear stress may relate to congestion, breathing difficulties, air hunger, irritation, and pain that disturbs sleep. The nose is a finely-tuned heat regulator and contains densely distributed thermoreceptors in the nasal vestibule (Jones et al., 1989). Disruption of these systems may lead to extreme mucosal drying and/or cooling with compensatory excesses in blood flow and mucus production, or lack of airflow sensation with increased feelings of congestion. Such disruptions can be inferred from CFD simulations.
CFD models have been used to estimate surgical effects on some of these variables but studies are lacking that test the discriminatory capability of these variables with respect to surgery, or relate these variables to patient symptoms. As part of a prospective study designed to fill these gaps, we developed methods to compare CFD-derived nasal resistance (CFD-NR) with validated patient-reported measures of NAO symptoms before and after surgery. In a preliminary application of these methods to two NAO patients, no relationship was evident between bilateral CFD-NR and symptom severity but a positive trend emerged when bilateral CFD-NR was replaced with unilateral CFD-NR on the most obstructed nasal side (Kimbell et al., 2012).
The goals of the present study were to expand these results to a larger cohort of NAO patients and compute airflow, wall shear stress, and heat flux in addition to CFD-NR pre- and post-surgery. The results were used to test the hypotheses that these variables can (1) discriminate between pre-surgery and post-surgery states, and (2) correlate with scores from symptom surveys administered before and after surgery.
2. Methods
2.1. Patient reported measures
The patient-reported measures of NAO symptoms used here were the Nasal Obstruction Symptom Evaluation (NOSE) scale to assess general symptomology and quality of life, and a 0-to-10 visual analog scale (VAS) for unilateral airflow sensation. The NOSE scale has been validated for NAO symptoms (Stewart et al., 2004a, 2004b) and consists of patient ratings, over the past month, of feelings of (1) nasal congestion or stuffiness, (2) nasal blockage or obstruction, (3) trouble breathing through the nose, (4) trouble sleeping, and (5) ability to get enough air through the nose during exercise or exertion. Patients are asked to use a 0-to-4 scale with 0=Not a problem, 1=Very mild problem, 2=Moderate problem, 3=Fairly bad problem, and 4=Severe problem. Each score is multiplied by 5 and the five scores are added together, producing total scores of 0 and 100 for the best and worst cases, respectively. For the VAS scale, patients rated sensation of airflow on each side of their nose separately from 0=completely blocked to 10=completely open.
2.2. Patients and treatment
NAO patients who were at least 15 years old, had a clinical diagnosis of non-reversible, surgically treatable nasal obstruction (deviated septum, turbinate hypertrophy resistant to medical treatment, or lateral nasal wall collapse), elected to have surgery, and provided informed consent were recruited from the Ear, Nose, and Throat clinic at Medical College of Wisconsin (MCW) (Kimbell et al., 2012). This study was approved by the Institutional Review Board at MCW and written informed consent was obtained from all subjects. Axial computed tomography (CT) scans with pixel sizes of 0.303 or 0.313 mm and 0.6-mm thickness were obtained pre-operatively and 5 to 8 months post-operatively in 24 subjects. After exclusions for functional endoscopic sinus surgery and unrepaired anatomical defects, pre- and post-surgery CT scans were available for 19 subjects.
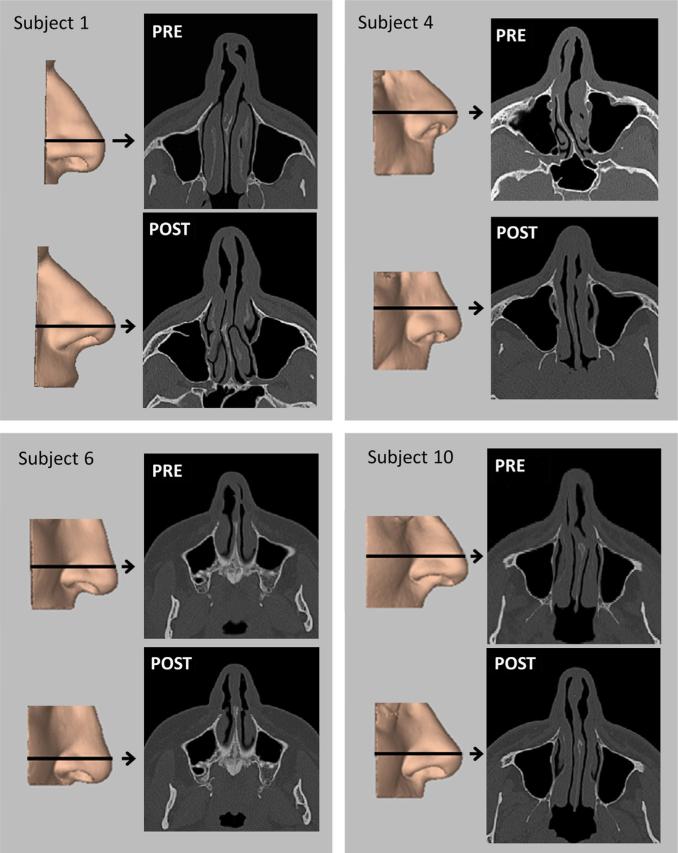
To minimize nasal cycling effects on CFD results, only subjects in whom mucosal thickness was generally symmetrical in right and left sides in both preand post-surgery scans were included in this analysis. This group consisted of 10 subjects (Fig. 1). All subjects were diagnosed with moderate to severe septal deviation, possibly with turbinate hypertrophy, external nasal deformities, and vestibular stenosis. All underwent septoplasty or septorhinoplasty, with additional procedures as needed (Table 1). All subjects received the normal standard of care and had normal post-operative courses.
Fig. 1.
Three-dimensional reconstructions of the external nose before (PRE) and after (POST) surgery for nasal airway obstruction in four subjects, with axial images from pre- and post-surgery CT scans. Arrows indicate level of scan image.
Table 1.
Diagnoses and surgical procedures in a cohort of 10 individuals with nasal airway obstruction.
| Subject (Gender) | Diagnoses | Predominant side of obstruction | Surgical procedure |
|---|---|---|---|
| 1 (Male) | Deviated nasal septum External nasal deformity |
Left | Septorhinoplasty |
| 2 (Female) | Deviated nasal septum External nasal deformity Inferior turbinate hypertrophy |
Right | Septorhinoplasty Turbinectomy |
| 3 (Male) | Deviated nasal septum External nasal deformity |
Right | Septal rhinoplasty |
| 4 (Male) | Deviated nasal septum External nasal deformity Inferior turbinate hypertrophy |
Right | Septorhinoplasty Turbinectomy |
| 5 (Female) | Deviated nasal septum Bilateral vestibular stenosis Bilateral inferior turbinate hypertrophy |
Right | Septoplasty Repair of bilateral vestibular stenosis with butterfly onlay graft Bilateral turbinectomy |
| 6 (Female) | Deviated nasal septum Bilateral vestibular stenosis |
Left | Septoplasty Repair of bilateral vestibular stenosis |
| 7 (Male) | Deviated nasal septum Inferior turbinate hypertrophy |
Left | Septoplasty Turbinectomy |
| 8 (Male) | Deviated nasal septum External nasal deformity Inferior turbinate hypertrophy |
Right | Septorhinoplasty Turbinectomy |
| 9 (Male) | Deviated nasal septum Bilateral inferior turbinate hypertrophy |
Left | Septoplasty Bilateral turbinectomy |
| 10 (Male) | Deviated nasal septum External nasal deformity Bilateral vestibular stenosis |
Right | Septorhinoplasty Repair of bilateral vestibular stenosis with spreader graft |
2.3. CFD analyses
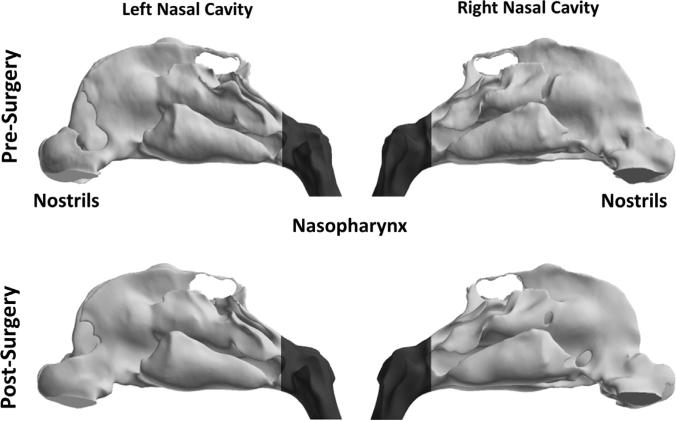
CFD models were created from the pre- and post-surgery CT scans of each subject as described by Frank et al. (2013) and Kimbell et al. (2012). Briefly, deidentified CT scans were imported into medical imaging software (Mimics™ 14.12, Materialise, Inc., Plymouth, MI). The main nasal passages were reconstructed in three dimensions (3D) from pixels between –1024 and –300 Hounsfield units, hand-edited to exclude the paranasal sinuses, using contour interpolation, 5 smoothing iterations with factor=0.9, and no matrix reduction. Nasal reconstructions were imported into computer-aided design software (ICEM-CFD™ 12.1, ANSYS, Inc., Canonsburg, PA). Nostril and outlet surfaces were made and outlet surfaces extruded 2 cm ventrally to form an outlet tube for increased numerical stability. Nasal wall regions were created for post-simulation analysis consisting of each nasal side, bounded by the nostril surface and a coronal cross-section at the posterior nasal septum (Fig. 2). Computational meshes were created using approximately 4 million graded tetrahedral elements as indicated by mesh density studies for mesh independent results.
Fig. 2.
Lateral views of pre- and post-surgery 3D reconstructions of the nasal passages of subject 1 showing division between main nasal cavity (light gray) and nasopharynx (dark gray) at the level of the posterior end of the nasal septum.
Steady-state simulations of laminar inspiratory airflow and heat transfer were conducted at resting breathing rates because (1) theoretical evidence supports the use of steady-state simulations to approximate cyclic breathing (Keyhani et al., 1995), (2) nasal airflow at resting breathing rates has been described as predominantly laminar in healthy individuals (Chung et al., 2006; Hahn et al., 1993; Kelly et al., 2000; Keyhani et al., 1995; Subramaniam et al., 1998; Xi and Longest, 2008), and (3) mucosal cooling, associated with nasal patency perception, occurs during inhalation. Although turbulence may be present in the abnormal nasal passages of NAO patients, NAO typically causes airway narrowing which at resting breathing flow rates is more likely to redirect airflow to more open parts of the nose than create jets or other turbulent flow conditions. Therefore turbulence modeling was not used.
The conservation of mass and momentum for laminar, incompressible flow are described, respectively, by the equations
where is the air velocity vector, t is time, ρ=1.204 kg/m3 is fluid density, and μ=1.825 × 10⁻⁵ kg/m-s is dynamic viscosity (Faber, 1995; Hinds, 1999; Naftali et al., 1998; White, 2008). Heat transfer is governed by the equation of energy conservation
where T = T(x, y, z, t) is temperature, cp = 1005.9 J/kg-K is specific heat, and k=0.0268 W/m-K is thermal conductivity of air (Naftali et al., 1998). Steady-state versions of these equations were solved using the finite volume method implemented by Fluent™ 14.0 (ANSYS, Inc., Canonsburg, PA) via Fluent's™ segregated solver with SIMPLEC pressure–velocity coupling and second-order, upwind discretization (Fluent, 2010). Since the physical properties of air were assumed constant, airflow and heat transport were decoupled. Residuals' convergence criteria were as follows: continuity: ≈ 10–4; velocities: ≈ 10–5, energy: ≈ 10–7.
Pressure boundary conditions were used to drive airflow at resting breathing in each subject. A target flow rate was set equal to twice each subject's estimated minute volume (amount of air exhaled in 1 min) based on gender-specific power law curves (Garcia et al., 2009):
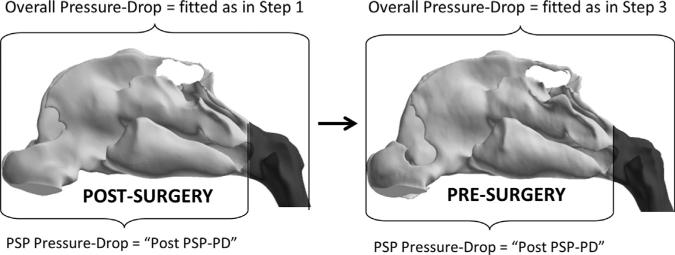
where V̇E is minute volume (L/min) and M is body mass (kg). Since these curves were derived for healthy individuals, an overall pressure drop from nostrils to outlet producing airflow approximating each target flow rate was determined in the healthier, post-surgery model for each subject (Fig. 3). An overall pressure drop from nostrils to pre-surgery outlet was then imposed so that the drop in pressure from the nostrils to a coronal plane at the posterior nasal septum was similar in both pre- and post-surgery models. This method avoided confounding effects on flow rates and pressure drops caused by dynamic differences in nasopharyngeal size (Kim et al., 2013), and was different from the method used by Kimbell et al. (2012) in which simulations were conducted with the same flow rate in pre- and post-surgery models.
Fig. 3.
Method for setting comparable steady-state, inspiratory airflow rates in pre- and post-operative states for an individual. Step 1: In the Post-Surgery CFD model, pressure drop from nostrils to outlet (Overall Pressure-Drop) was fitted to target flow rate for normal resting breathing. Step 2: Pressure drop from nostrils to posterior end of nasal septum (PSP Pressure-Drop) was calculated from the Post-Surgery CFD model. This value was called “Post PSP-PD”. Step 3: In the Pre-Surgery CFD model, Overall Pressure-Drop fitted so that PSP Pressure-Drop=“Post PSP-PD” value.
Uncoupled heat transport simulations were conducted with nasal mucosal temperature during inspiration set to 32.6 1C (Garcia et al., 2007), an average of values reported by Lindemann et al. (2002). Ambient air temperature was set to 20 1C. A boundary specifying that at the outlet, where is a unit vector normal to the surface, was also imposed.
Volumetric airflow, nasal resistance, wall shear rate and heat flux were computed bilaterally and unilaterally. Bilateral variables were total volumetric airflow (Airflow-Bilateral, L/min), nasal resistance (CFDNR-Bilateral, Pa/(ml/s)), wall shear rate (Wall Shear-Bilateral, Pa), and total heat flux (Heat Flux-Bilateral, W/m2). These variables were also reported unilaterally for the most obstructed nasal side (Airflow-OS, CFDNR-OS, Wall Shear-OS, and Heat Flux-OS) and the less obstructed side (Airflow-US, CFDNR-US, Wall Shear-US, and Heat Flux-US). Airflow-OS and CFDNR-OS were also normalized as the percent of Airflow-Bilateral allocated to the most obstructed side (Airflow Partition-OS) and CFDNR-OS divided by CFDNR-Bilateral (CFDNR Ratio-OS, equal to 1/Airflow Partition-OS), respectively.
Nasal resistance was computed as the drop in area-weighted average pressure from nostrils to posterior septum divided by volumetric flow. Wall shear stress (Pa) was calculated as
where τw is wall shear stress, τ is air shear stress, y is the direction perpendicular to the nasal wall, μ is dynamic viscosity, and u is the tangential component of air velocity. Heat flux (W/m2) was calculated as
where hf is the fluid-side local heat transfer coefficient, Tw is wall surface temperature, and Tf is local fluid temperature. Area-weighted averages of wall shear stress and heat flux were calculated as
where A was either the bilateral or unilateral surface area from the nostrils to the posterior end of the nasal septum (Fig. 2). Analysis and visualization of results were conducted using Fluent™ and the post-processing software Fieldview™ 13 (Intelligent Light, Lyndhurst, NJ).
2.4. Statistical analyses
Two-tailed, paired t-tests in Excel 2010™ (Microsoft, Redmond, WA) were used to test the null hypotheses that (1) pre-surgery and post-surgery values were indistinguishable, and (2) unilateral variables on the most obstructed and less obstructed sides were indistinguishable. Linear regression in Excel 2010™ was used to compare the extent to which CFD variables correlated with NOSE and VAS scores. Correlations were categorized as “strong” if the absolute value of the Pearson correlation coefficient, r, was greater than 0.8, “moderate” if the absolute value of r was greater than 0.6 and less than 0.8, and not evident if the absolute value of r was less than 0.6. CFD variables and survey results were assumed to represent a continuum of effects regardless of surgical status, so pre- and post-surgery values for a given variable were regressed together.
3. Results
3.1. Surveys
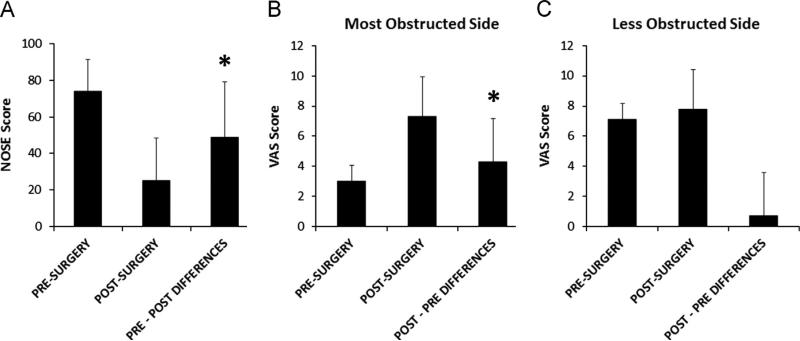
NOSE scores (Table 2) improved with surgery in nine subjects and were the same pre- and post-operatively in one subject. On average, post-surgery NOSE scores were lower than pre-surgery scores (Fig. 4A). As expected, since the NOSE instrument has been validated for assessing NAO symptoms (Stewart et al., 2004a), pairwise differences between pre- and post-surgery NOSE scores were statistically significant (Table 3). VAS scores on the most obstructed nasal side (VAS-OS) improved with surgery in nine subjects and worsened in one subject. On average, post-operative VAS-OS scores (Table 2) were higher than pre-operative values (Fig. 4B), and pairwise pre- and post-operative differences were statistically significant (Table 3). Also as expected, post-operative VAS scores on the less obstructed side (VAS-US) were not significantly different from pre-operative scores (Tables 2 and 3, Fig. 4C).
Table 2.
Surveys and CFD variables: average values and differences.
| Pre-surgery average ± SDa | Post-surgery average ± SD | Change average ± SD | |
|---|---|---|---|
| Surveys | |||
| NOSEb | 74 ± 18 | 25 ± 23 | –497 30* |
| VAS-OSc | 3 ± 1 | 7 ± 3 | + 4 ± 3* |
| VAS-USd | 7 ± 2 | 8 ± 2 | +1 ± 3 |
| Bilateral variables | |||
| Airflow-Bilateral, L/min | 12.9 ± 3.7 | 17.8 ± 2.7 | + 4.8 ± 3.4* |
| CFDNRe-Bilateral, Pa/(ml/s) | 0.127± 0.080 | 0.084 ± 0.031 | –0.043 ± 0.056* |
| Heat Flux-Bilateral, W/m2 | 163.0 ± 40.7 | 216.8 ± 24.1 | + 53.8 ± 42.2* |
| Wall Shear-Bilateral, Pa | 0.106 ± 0.032 | 0.127 ± 0.036 | + 0.021 ± 0.035 |
| Unilateral variables - most obstructed side | |||
| Airflow-OS, L/min | 4.8 ± 1.9 | 9.2 ± 1.9 | + 4.4 ± 1.4* |
| CFDNR-OS, Pa/(ml/s) | 0.374 ± 0.301 | 0.161 ± 0.054 | –0.213 ± 0.259* |
| Heat Flux-OS, W/m2 | 125.0 ± 42.6 | 215.7 ± 30.9 | + 90.7 ± 46.5* |
| Wall Shear-OS, Pa | 0.084 ± 0.033 | 0.123 ± 0.038 | + 0.038 ± 0.047* |
| Airflow Partition-OS | 36.5% ± 8.4% | 51.8% ± 6.7% | +15.3% ± 7.3%* |
| CFDNR Ratio-OS | 2.86 ± 0.61 | 1.96 ± 0.25 | –0.90 ± 0.49* |
| Unilateral variables - less obstructed side | |||
| Airflow-US, L/min | 8.1 ± 2.4 | 8.5 ± 1.6 | + 0.4 ± 2.4 |
| CFDNR-US, Pa/(ml/s) | 0.201 ± 0.112 | 0.181 ± 0.082 | –0.020 ± 0.066 |
| Heat Flux-US, W/m2 | 199.4 ± 49.4 | 217.3 ± 35.1 | + 17.8 ± 45.0 |
| Wall Shear-US, Pa | 0.127 ± 0.037 | 0.131 ± 0.036 | + 0.004 ± 0.027 |
SD: sample standard deviation, calculated using “n - 1” method.
NOSE: Nasal Obstruction Symptom Evaluation.
VAS-OS: VAS - Visual analog scale, OS - most obstructed side.
US: less obstructed side.
CFDNR: CFD-derived nasal resistance.
Indicates statistical significance at P < 0.05 level.
Fig. 4.
Survey results. Average pre- and post-surgery survey scores and average pairwise differences between pre- and post-surgery values. Error bars indicate one sample standard deviation. Asterisks indicate statistically significant differences. (A) NOSE scores. (B) VAS scores on the most obstructed side. (C) VAS scores on the less unobstructed side.
Table 3.
P-values in statistical test of pairwise differences between pre- and post-surgery surveys and CFD variable values.
| Two-tailed, paired t-test comparing pre- and post-surgery values (P-value) | |
|---|---|
| Surveys | |
| NOSEa | 0.00061 |
| VAS-OSb | 0.0011 |
| VAS-USc | 0.52 |
| Variables showing significant differences (P < 0.05) | |
| Airflow-Bilateral | 0.002 |
| CFDNRd-Bilateral | 0.038 |
| Heat Flux-Bilateral | 0.003 |
| Airflow-OS | 0.000003 |
| CFDNR-OS | 0.029 |
| Heat Flux-OS | 0.0002 |
| Wall Shear-OS | 0.031 |
| Airflow Partition-OS | 0.0001 |
| CFDNR Ratio-OS | 0.0002 |
| Remaining variables | |
| Wall Shear-Bilateral | 0.09 |
| Airflow-US | 0.60 |
| CFDNR-US | 0.37 |
| Heat Flux-US | 0.24 |
| Wall Shear-US | 0.65 |
NOSE: Nasal Obstruction Symptom Evaluation.
VAS-OS: VAS - Visual analog scale, OS - most obstructed side.
US: less obstructed side.
CFDNR: CFD-derived nasal resistance.
In this study, the VAS survey was able to discriminate between most obstructed and less obstructed sides before but not after surgery. Before surgery, VAS-US scores were significantly higher than VAS-OS scores for all subjects.
3.2. Bilateral variables
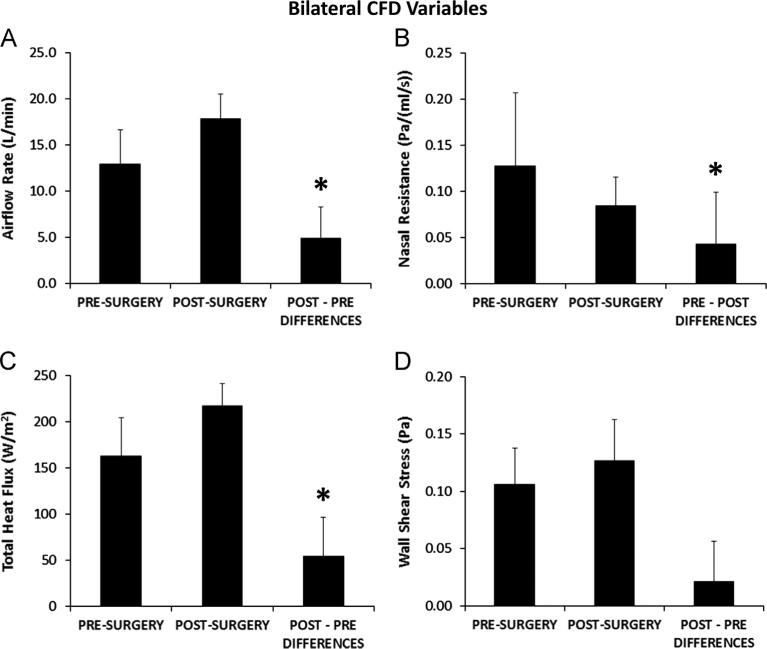
Airflow-Bilateral differed between pre- and post-surgery models for each subject due to the use of the same pressure drop to drive the flow in both models. In all subjects, the overall pressure drop used to drive the target flow rate in the post-surgery model produced less flow pre-operatively (Table 2, Fig. 5A) with statistically significant pairwise differences (Table 3). Pre-operative flow rates ranged from 42% to 92% of the post-operative flow rate. Statistically significant changes with surgery (Table 3) were also found for CFDNR-Bilateral and Heat Flux-Bilateral, but not for Wall Shear-Bilateral (Fig. 5B, C, D). CFDNR-Bilateral decreased with surgery in every subject. Due primarily to increased postoperative airflow, surgery increased Heat Flux-Bilateral in every subject and Wall Shear-Bilateral in seven subjects.
Fig. 5.
Bilateral variable results. Average pre-surgery and post-surgery biophysical variables measured bilaterally from the nostrils to the posterior end of the nasal septum, and average pairwise differences between pre- and post-surgery values. Error bars indicate one sample standard deviation. Asterisks indicate statistically significant differences. (A) Total inspiratory airflow rate (Airflow-Bilateral). (B) Bilateral nasal resistance (CFDNR-Bilateral). (C) Total heat flux per unit surface area (Heat Flux-Bilateral). (D) Average shear stress on the walls of the nasal cavity (Wall Shear-Bilateral).
3.3. Unilateral variables
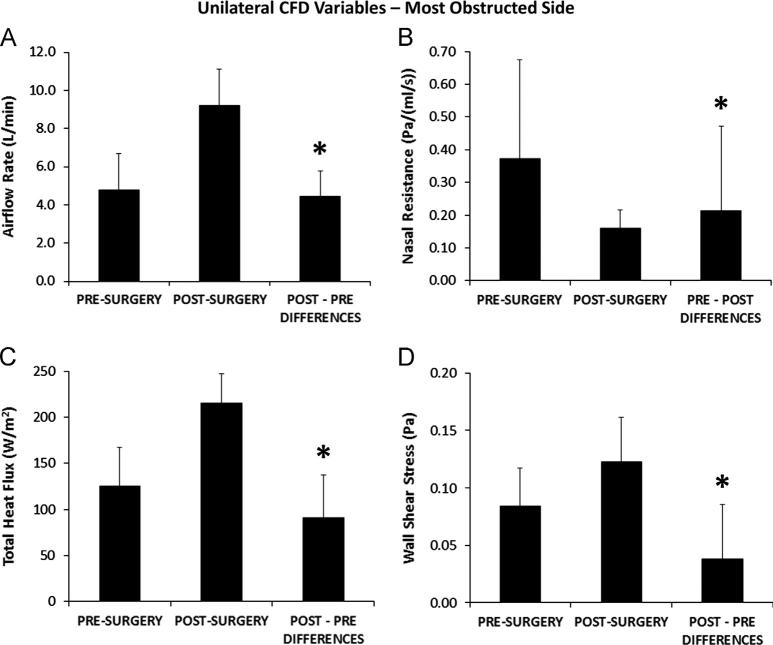
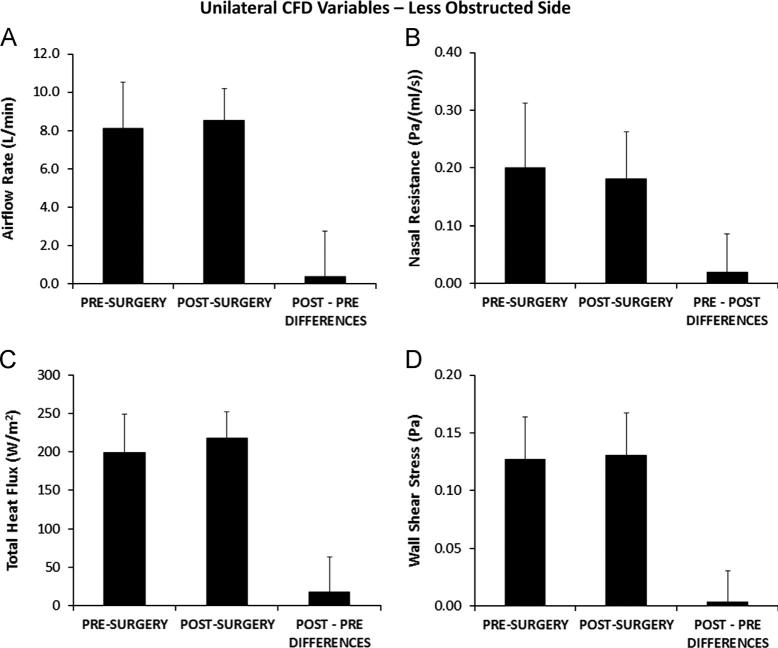
Airflow-OS (Table 2) increased with surgery in every subject with statistically significant pairwise differences between pre- and post-surgery flows (Table 3), while Airflow-US did not change significantly with surgery (Figs. 6A and 7A). Statistically significant changes with surgery (Table 3) were also found for CFDNR-OS as well as Heat Flux-OS, Wall Shear-OS (Fig. 6B, C, and D), and CFDNR Ratio-OS. CFDNR-OS decreased and Heat Flux-OS increased with surgery in every subject, and Wall Shear-OS increased in all but two subjects. In the less obstructed side, pre- and post-surgery values were not significantly different (Table 3) for CFDNR-US, Heat Flux-US, and Wall Shear-US (Fig. 7B, C, and D).
Fig. 6.
Unilateral variable results on the most obstructed side. Pre-surgery and post-surgery biophysical variables measured from the nostrils to the posterior end of the nasal septum in the most obstructed nasal side, and average pairwise differences between pre- and post-surgery values. Error bars indicate one sample standard deviation. Asterisks indicate statistically significant differences. (A) Unilateral inspiratory airflow rate (Airflow-OS). (B) Unilateral nasal resistance (CFDNR-OS). (C) Total heat flux per unit surface area (Heat Flux-OS). (D) Average shear stress on the walls of the nasal cavity (Wall Shear-OS).
Fig. 7.
Unilateral variable results on the less obstructed side. Pre-surgery and post-surgery biophysical variables measured from the nostrils to the posterior end of the nasal septum in the less obstructed nasal side, and average pairwise differences between pre- and post-surgery values. Error bars indicate one sample standard deviation. Pairwise differences between pre-surgery and post-surgery values were not statistically different. (A) Unilateral inspiratory airflow rate (Airflow-US). (B) Unilateral nasal resistance (CFDNR-US). (C) Total heat flux per unit surface area (Heat Flux-US). (D) Average shear stress on the walls of the nasal cavity (Wall Shear-US).
All unilateral CFD variables were able to discriminate between most obstructed and less obstructed sides before surgery and unable to do so after surgery. In 9 of the 10 subjects, pre-operative values of Airflow-OS, Heat Flux-OS, and Wall Shear-OS were lower, and CFDNR-OS values were higher, than pre-operative Airflow-US, Heat Flux-US, Wall Shear-US and CFDNR-US values, respectively.
3.4. Correlating surveys and CFD variables
NOSE scores and VAS-OS scores were strongly correlated with each other (r = –0.83). No linear correlation was detectable between NOSE scores and VAS-US scores (r =–0.29), or between VAS-OS and VAS-US (r = 0.49).
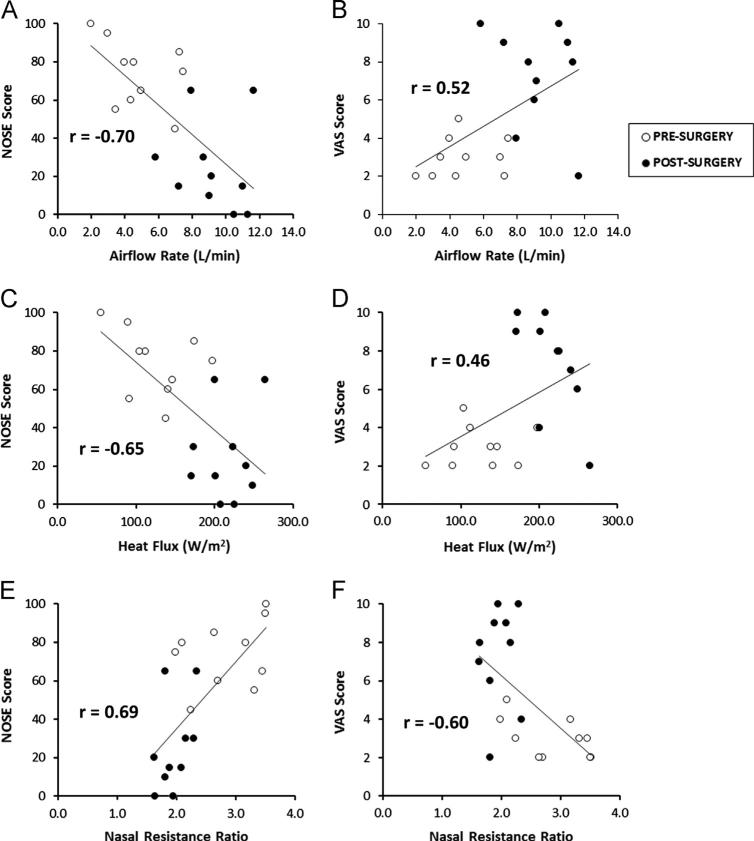
We were not able to detect strong linear correlations of NOSE or VAS-OS scores with any individual CFD variable (Table 4). Moderate linear correlations were detected for regression of NOSE scores on Airflow-OS, Heat Flux-OS, Airflow Partition-OS, and CFDNR Ratio-OS, and for regression of VAS-OS scores on CFDNR Ratio-OS (Fig. 8). As expected, since Airflow Partion-OS and CFDNR Ratio-OS are nonlinearly related, correlations of these variables with quality-of-life scores differed slightly. No correlation was detected for regression of NOSE scores on any bilateral variable (Table 4). In particular, we did not see evidence of correlation from regression of symptom severity on either bilateral or unilateral CFD-NR, though regression of NOSE scores on unilateral CFD-NR produced a stronger trend (r=0.48) than bilateral CFD-NR (r=0.33) in agreement with our previous work (Kimbell et al., 2012).
Table 4.
Pearson correlation coefficients for linear regression of survey results on CFD variables with statistically significant pre- and post-surgery differences.
| CFD variable | Linear correlation coefficient (r): regression of NOSE score on variable | Linear correlation coefficient (r): regression of VAS-OS score on variable |
|---|---|---|
| Bilateral variables | ||
| Airflow-Bilateral | –0.54 | – |
| CFDNRa-Bilateral | 0.33 | – |
| Heat Flux-Bilateral | –0.45 | – |
| Unilateral variables | ||
| Airflow-OSb | –0.70 Moderate | 0.52 |
| CFDNR-OS | 0.48 | –0.42 |
| Heat Flux-OS | –0.65 Moderate | 0.46 |
| Wall Shear-OS | –0.51 | 0.32 |
| Airflow Partition-OS | –0.71 Moderate | 0.58 |
| CFDNR Ratio-OS | 0.69 Moderate | –0.60 Moderate |
CFDNR: CFD-derived nasal resistance.
OS: most obstructed side.
Fig. 8.
Correlations among subjective and objective measures of nasal airflow. (A) NOSE scores plotted against unilateral airflow on the most obstructed side (Airflow-OS). (B) Visual analog scale (VAS) scores plotted against Airflow-OS. (C) NOSE scores vs. unilateral heat flux on the most obstructed side (Heat Flux-OS). (D) VAS scores vs. Heat Flux-OS. (E) NOSE scores plotted against unilateral nasal resistance ratio on the most obstructed side (CFDNR Ratio-OS). (F) VAS scores plotted against CFDNR Ratio-OS.
4. Discussion
In order to improve the success rate of NAO surgery using CFD, biophysical variables need to be identified that can be markers for symptoms of NAO so that these variables can eventually help guide virtual surgeries. Nasal airflow, resistance, heat flux, and wall shear were selected for this report due to the symptom relevance of airway constriction (Garcia et al., 2010), correlation of heat flux with perceived patency ratings (Zhao et al., 2011), and the potential mechanoreceptor stimulator role of wall shear stress (Elad et al., 2006). The goal of this study was to compare CFD-derived values of these variables before and after surgery and correlate values with patient symptoms to determine which variables may be candidates for use in future virtual NAO surgery planning.
All of these variables were significantly affected by surgery when calculated on the most obstructed side (Table 3, Fig. 6). Airflow, heat flux, airflow partitioning, and nasal resistance ratio were also moderately correlated with patient-reported symptoms when calculated on the most obstructed nasal side (Table 4, Fig. 8). Similarity in the strengths of these correlations and the finding that no particular CFD variable correlated strongly with symptoms, suggests that patient-reported symptoms may represent a constellation of effects. Thus Airflow-OS, Heat Flux-OS, Airflow Partition-OS, and CFDNR Ratio-OS are proposed as variables that should be tracked concurrently during future virtual surgery planning.
Since airflow directly affects resistance and heat flux, correlations were evident among the CFD variables above (data not shown). However, tracking each of these variables is recommended because they have different physiological interpretations. For example, while heat flux and nasal resistance are inter-related (lower resistance increases airflow and thus heat loss), their contributions to nasal patency perception are distinct. Nasal resistance measures effort (pressure drop) of breathing, while heat flux measures mucosal cooling, sensed by thermoreceptors on the nasal mucosa. Future research should investigate the relationships among these variables and their relative contribution to nasal patency perception. Possible effects of exhalation and localized turbulence, unexplored here, may also be important and should be investigated in future studies.
Correlations of CFD variables with symptoms were stronger for symptoms reported using the NOSE survey than for those measured by the VAS scale (Table 4). The NOSE survey requested patients to consider symptoms over the past month, while the VAS scale measured immediate perception of nasal side-specific airflow blockage. This difference may make NOSE scores somewhat less susceptible to congestive effects from nasal cycling or other factors than VAS scores. CT scans used in this study were not necessarily obtained at the same time that subjects filled out their surveys. Thus VAS scores could be affected by congestive factors that differed between CT scan and survey, reducing correlation of VAS scores with CFD variables based on CT scans acquired at different times.
Airflow and nasal resistance calculated for the most obstructed nasal side were reported from CFD simulations in both raw and normalized forms. Correlations with NOSE and VAS-OS scores were stronger for the normalized forms of these variables than for the raw forms (Table 4), and CFDNR Ratio-OS was the only variable that correlated at a moderate level with both NOSE and VAS-OS scores. This result suggests that normalization may be helpful in further studies correlating CFD variables with patient-reported symptoms.
An unresolved issue in nasal CFD studies is whether one should compare pre- and post-surgery simulations in which transnasal pressure drops are the same or in which the flow rates are the same. Some of the pre-surgery nasal models showed considerable blockage, requiring very large pressure drops to achieve the target flow rate. In reality, patients might switch to oronasal breathing under such conditions rather than exert a large effort to breathe entirely nasally. With the assumption that the effort of nasal breathing was related to transnasal pressure drop, we opted to use similar pressure drops between pre- and post-surgery cases. Because the nasopharynx is dynamic and often showed different widths in pre- and post-surgery scans, we compared pre- and post-surgery simulations in which the pressure drop from the nostrils to the non-dynamic posterior end of the nasal septum was the same, rather than equating overall pressure drops from nostrils to the model's outlet.
Existing clinical tools such as rhinomanometry can calculate nasal resistance but cannot provide an etiology for the obstruction – e.g. anatomic information of the nasal airway or exact location of the obstruction. Other variables such as heat fluxes and nasal wall shear stress have not been measured with conventional or existing techniques. The ability to obtain information about these variables is unique to CFD technology; however, CFD variables must also be able to detect surgical changes and correlate with patient symptoms to be useful in surgical planning. This study is the first to provide a quantitative evaluation of these requirements indicating that CFD-derived Airflow-OS, Heat Flux-OS, Airflow Partition-OS, and CFDNR Ratio-OS have the most potential to help guide future virtual surgery planning. As further analysis is undertaken to better understand the predictive capability of CFD methods, it is not too hard to imagine a day when a tool will be at hand to aid surgeons in designing specific surgical techniques or interventions that will maximize successful outcomes.
Acknowledgments
The authors thank Nikki Stelse, Sachin Pawar and Daniel Cannon for contributions to this work. This research was funded by Grants R01EB009557 and R01EB009557-01S1 from the National Institutes of Health/National Institute of Biomedical Imaging and Bioengineering to the Medical College of Wisconsin (MCW) and by subcontract from MCW to the University of North Carolina at Chapel Hill. This description of results from this research is solely the responsibility of the authors and does not represent the official views of the NIH. GJMG was funded in part by the Brazilian science agency CNPq.
Footnotes
Conflict of interest statement
To the best of our knowledge, no conflicts of interest exist for any of the authors.
References
- Andre RF, D'Souza AR, Kunst HP, Vuyk HD. Sub-alar batten grafts as treatment for nasal valve incompetence; description of technique and functional evaluation. Rhinology. 2006;44:118–122. [PubMed] [Google Scholar]
- Chen XB, Lee HP, Chong VF, Wang de Y. Assessment of septal deviation effects on nasal air flow: a computational fluid dynamics model. Laryngoscope. 2009;119:1730–1736. doi: 10.1002/lary.20585. [DOI] [PubMed] [Google Scholar]
- Chung SK, Son YR, Shin SJ, Kim SK. Nasal airflow during respiratory cycle. American Journal of Rhinology. 2006;20:379–384. doi: 10.2500/ajr.2006.20.2890. [DOI] [PubMed] [Google Scholar]
- Dinis PB, Haider H. Septoplasty: long-term evaluation of results. American Journal of Otolaryngology. 2002;23:85–90. doi: 10.1053/ajot.2002.30987. [DOI] [PubMed] [Google Scholar]
- Elad D, Naftali S, Rosenfeld M, Wolf M. Physical stresses at the air–wall interface of the human nasal cavity during breathing. Journal of Applied Physiology. 2006;100:1003–1010. doi: 10.1152/japplphysiol.01049.2005. [DOI] [PubMed] [Google Scholar]
- Faber TE. Fluid Dynamics for Physicists. Cambridge University Press; Cambridge, UK: 1995. [Google Scholar]
- Fluent . User's Guide. ANSYS, Inc.; Lebanon, NH: 2010. [Google Scholar]
- Frank DO, Kimbell JS, Cannon D, Rhee JS. Computed intranasal spray penetration: comparisons before and after nasal surgery. International Forum of Allergy & Rhinology. 2013;3(1):48–55. doi: 10.1002/alr.21070. [DOI] [PMC free article] [PubMed] [Google Scholar]
- Garcia GJ, Bailie N, Martins DA, Kimbell JS. Atrophic rhinitis: a CFD study of air conditioning in the nasal cavity. Journal of Applied Physiology. 2007;103:1082–1092. doi: 10.1152/japplphysiol.01118.2006. [DOI] [PubMed] [Google Scholar]
- Garcia GJ, Rhee JS, Senior BA, Kimbell JS. Septal deviation and nasal resistance: an investigation using virtual surgery and computational fluid dynamics. American Journal of Rhinology & Allergy. 2010;24:e46–53. doi: 10.2500/ajra.2010.24.3428. [DOI] [PubMed] [Google Scholar]
- Garcia GJ, Schroeter JD, Segal RA, Stanek J, Foureman GL, Kimbell JS. Dosimetry of nasal uptake of water-soluble and reactive gases: a first study of interhuman variability. Inhalation Toxicology. 2009;21:607–618. doi: 10.1080/08958370802320186. [DOI] [PubMed] [Google Scholar]
- Hahn I, Scherer PW, Mozell MM. Velocity profiles measured for airflow through a large-scale model of the human nasal cavity. Journal of Applied Physiology. 1993;75:2273–2287. doi: 10.1152/jappl.1993.75.5.2273. [DOI] [PubMed] [Google Scholar]
- Hinds WC. Aerosol Technology: Properties, Behavior, and Measurement of Airborne Particles. Wiley; New York, NY: 1999. [Google Scholar]
- Illum P. Septoplasty and compensatory inferior turbinate hypertrophy: long-term results after randomized turbinoplasty. European Archives of Otorhinolaryngology. 1997;254(Suppl. 1):S89–92. doi: 10.1007/BF02439733. [DOI] [PubMed] [Google Scholar]
- Jessen M, Malm L. Definition, prevalence and development of nasal obstruction. Allergy. 1997;52:3–6. doi: 10.1111/j.1398-9995.1997.tb04876.x. [DOI] [PubMed] [Google Scholar]
- Jones AS, Wight RG, Durham LH. The distribution of thermoreceptors within the nasal cavity. Clinical Otolaryngology and Allied Sciences. 1989;14:235–239. doi: 10.1111/j.1365-2273.1989.tb00367.x. [DOI] [PubMed] [Google Scholar]
- Kelly JT, Prasad AK, Wexler AS. Detailed flow patterns in the nasal cavity. Journal of Applied Physiology. 2000;89:323–337. doi: 10.1152/jappl.2000.89.1.323. [DOI] [PubMed] [Google Scholar]
- Keyhani K, Scherer PW, Mozell MM. Numerical simulation of airflow in the human nasal cavity. Journal of Biomechanical Engineering. 1995;117:429–441. doi: 10.1115/1.2794204. [DOI] [PubMed] [Google Scholar]
- Kim SK, Na Y, Kim JI, Chung SK. Patient specific CFD models of nasal airflow: overview of methods and challenges. Journal of Biomechanics. 2013;46:299–306. doi: 10.1016/j.jbiomech.2012.11.022. [DOI] [PubMed] [Google Scholar]
- Kimbell JS, Garcia GJ, Frank DO, Cannon DE, Pawar SS, Rhee JS. Computed nasal resistance compared with patient-reported symptoms in surgically treated nasal airway passages: a preliminary report. American Journal of Rhinology & Allergy. 2012;26:e94–98. doi: 10.2500/ajra.2012.26.3766. [DOI] [PMC free article] [PubMed] [Google Scholar]
- Kimbell JS, Segal RA, Asgharian B, Wong BA, Schroeter JD, Southall JP, Dickens CJ, Brace G, Miller FJ. Characterization of deposition from nasal spray devices using a computational fluid dynamics model of the human nasal passages. Journal of Aerosol Medicine. 2007;20:59–74. doi: 10.1089/jam.2006.0531. [DOI] [PubMed] [Google Scholar]
- Kjaergaard T, Cvancarova M, Steinsvag SK. Does nasal obstruction mean that the nose is obstructed? Laryngoscope. 2008;118:1476–1481. doi: 10.1097/MLG.0b013e318173a025. [DOI] [PubMed] [Google Scholar]
- Lam DJ, James KT, Weaver EM. Comparison of anatomic, physiological, and subjective measures of the nasal airway. American Journal of Rhinology. 2006;20:463–470. doi: 10.2500/ajr.2006.20.2940. [DOI] [PubMed] [Google Scholar]
- Leong SC, Chen XB, Lee HP, Wang DY. A review of the implications of computational fluid dynamic studies on nasal airflow and physiology. Rhinology. 2010;48:139–145. doi: 10.4193/Rhin09.133. [DOI] [PubMed] [Google Scholar]
- Lindemann J, Keck T, Wiesmiller K, Sander B, Brambs HJ, Rettinger G, Pless D. Nasal air temperature and airflow during respiration in numerical simulation based on multislice computed tomography scan. American Journal of Rhinology. 2006;20:219–223. [PubMed] [Google Scholar]
- Lindemann J, Leiacker R, Rettinger G, Keck T. Nasal mucosal temperature during respiration. Clinical Otolaryngology and Allied Sciences. 2002;27:135–139. doi: 10.1046/j.1365-2273.2002.00544.x. [DOI] [PubMed] [Google Scholar]
- Naftali S, Schroter RC, Shiner RJ, Elad D. Transport phenomena in the human nasal cavity: a computational model. Annals of Biomedical Engineering. 1998;26:831–839. doi: 10.1114/1.108. [DOI] [PubMed] [Google Scholar]
- Pawar SS, Garcia GJ, Kimbell JS, Rhee JS. Objective measures in aesthetic and functional nasal surgery: perspectives on nasal form and function. Facial Plastic Surgery. 2010;26:320–327. doi: 10.1055/s-0030-1262314. [DOI] [PMC free article] [PubMed] [Google Scholar]
- Rhee JS. Measuring outcomes in nasal surgery: realities and possibilities. Archives of Facial Plastic Surgery. 2009;11:416–419. doi: 10.1001/archfacial.2009.86. [DOI] [PMC free article] [PubMed] [Google Scholar]
- Rhee JS, Cannon DE, Frank DO, Kimbell JS. Role of virtual surgery in preoperative planning: assessing the individual components of functional nasal airway surgery. Archives of Facial Plastic Surgery. 2012;14:354–359. doi: 10.1001/archfacial.2012.182. [DOI] [PMC free article] [PubMed] [Google Scholar]
- Rhee JS, McMullin BT. Outcome measures in facial plastic surgery: patient-reported and clinical efficacy measures. Archives of Facial Plastic Surgery. 2008;10:194–207. doi: 10.1001/archfaci.10.3.194. [DOI] [PubMed] [Google Scholar]
- Schumacher MJ. Nasal congestion and airway obstruction: the validity of available objective and subjective measures. Current Allergy and Asthma Reports. 2002;2:245–251. doi: 10.1007/s11882-002-0026-x. [DOI] [PubMed] [Google Scholar]
- Singh A, Patel N, Kenyon G, Donaldson G. Is there objective evidence that septal surgery improves nasal airflow? The Journal of Laryngology and Otology. 2006;120:916–920. doi: 10.1017/S0022215106003410. [DOI] [PubMed] [Google Scholar]
- Stewart MG, Smith TL, Weaver EM, Witsell DL, Yueh B, Hannley MT, Johnson JT. Outcomes after nasal septoplasty: results from the Nasal Obstruction Septoplasty Effectiveness (NOSE) study. Otolaryngology—Head and Neck Surgery. 2004a;130:283–290. doi: 10.1016/j.otohns.2003.12.004. [DOI] [PubMed] [Google Scholar]
- Stewart MG, Witsell DL, Smith TL, Weaver EM, Yueh B, Hannley MT. Development and validation of the Nasal Obstruction Symptom Evaluation (NOSE) scale. Otolaryngology—Head and Neck Surgery. 2004b;130:157–163. doi: 10.1016/j.otohns.2003.09.016. [DOI] [PubMed] [Google Scholar]
- Subramaniam RP, Richardson RB, Morgan KT, Guilmette RA, Kimbell JS. Computational fluid dynamics simulations of inspiratory airflow in the human nose and nasopharynx. Inhalation Toxicology. 1998;10:91–120. [Google Scholar]
- Tarabichi M, Fanous N. Finite element analysis of airflow in the nasal valve. Otolaryngology—Head and Neck Surgery. 1993;119:638–642. doi: 10.1001/archotol.1993.01880180054010. [DOI] [PubMed] [Google Scholar]
- Wang DY, Lee HP, Gordon BR. Impacts of fluid dynamics simulation in study of nasal airflow physiology and pathophysiology in realistic human three-dimensional nose models. Clinical and Experimental Otorhinolaryngology. 2012;5:181–187. doi: 10.3342/ceo.2012.5.4.181. [DOI] [PMC free article] [PubMed] [Google Scholar]
- Wexler D, Segal R, Kimbell J. Aerodynamic effects of inferior turbinate reduction: computational fluid dynamics simulation. Archives of Otolaryngology—Head and Neck Surgery. 2005;131:1102–1107. doi: 10.1001/archotol.131.12.1102. [DOI] [PubMed] [Google Scholar]
- White FM. Fluid Mechanics. McGraw-Hill; New York, NY: 2008. [Google Scholar]
- Xi JX, Longest PW. Numerical predictions of submicrometer aerosol deposition in the nasal cavity using a novel drift flux approach. International Journal of Heat and Mass Transfer. 2008;51:5562–5577. [Google Scholar]
- Zhao K, Blacker K, Luo Y, Bryant B, Jiang J. Perceiving nasal patency through mucosal cooling rather than air temperature or nasal resistance. PLoS One. 2011;6:e24618. doi: 10.1371/journal.pone.0024618. [DOI] [PMC free article] [PubMed] [Google Scholar]


