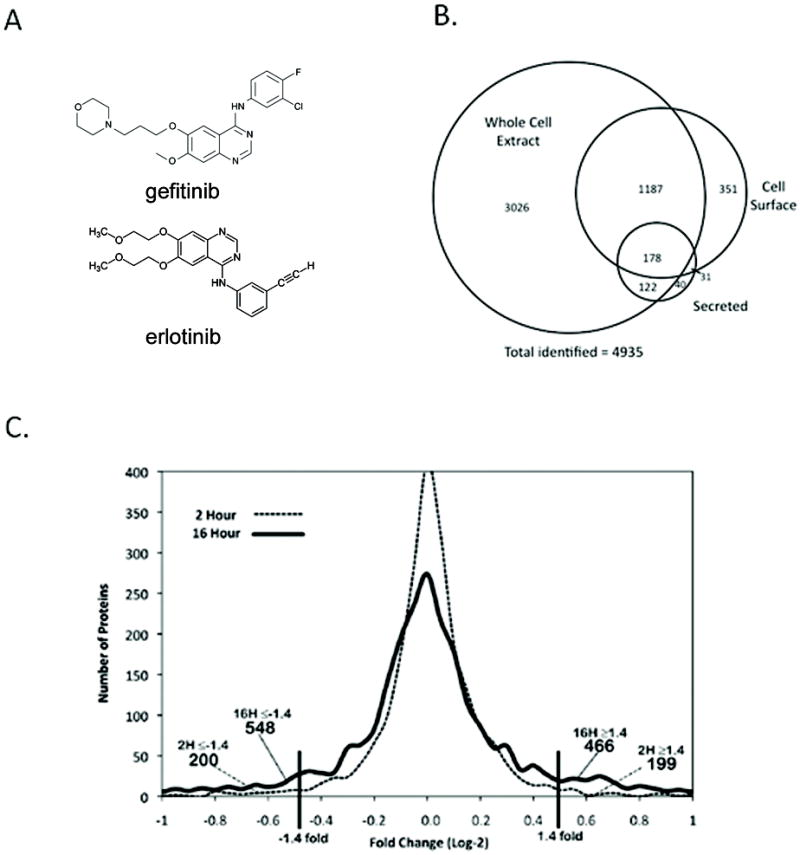
Figure 1. Sub-proteome analysis of A431 cells with and without gefitinib treatment.

A431 cells were maintained in SILAC media and treated with 100 nM gefitinib for either 2 or 16 hours and analyzed by LC-MS/MS. Cell-surface proteins were isolated by biotin labeling and subsequently captured by avidin chromatography. Solid-phase extraction of glycoproteins was used to enrich in shed proteins. A) Chemical structure of gefitinib (top) and erlotinib (bottom). B) Total protein identifications based on compartment with a PeptideProphet score ≥ 0.9 and ProteinProphet score of ≥ 0.90. C) Histogram of (log2) fold change versus unique protein identifications for the 2 hr and 16 hr treatments shows quantitative changes in A431 proteomes were greater after 16 hours.
