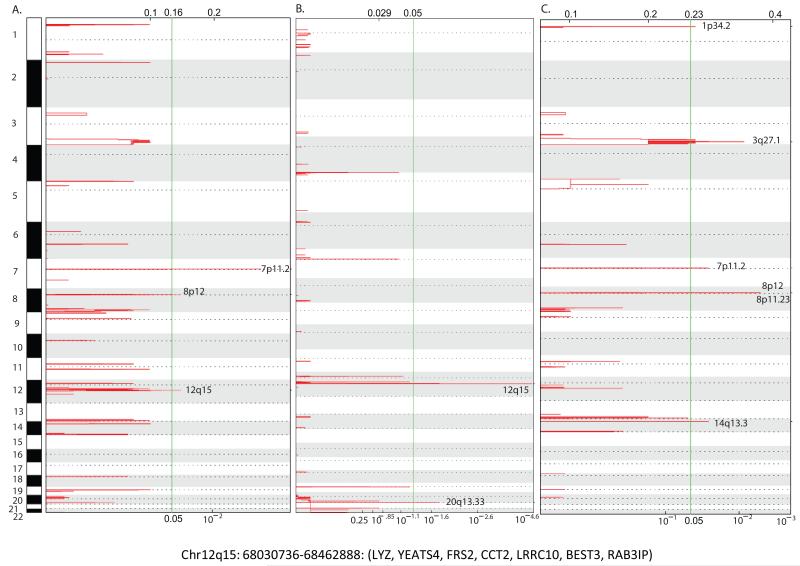
Figure 1. Recurrent amplifications in NSCLC.
GISTIC plots for (A) 261 NSCLC, (B) 169 AC and (C) 92 SqCC. Chromosomes are depicted as rows and chromosome numbers are indicated. Red peaks indicate frequently amplified regions and the green vertical line indicates the false discovery rate threshold (q=0.05). Peaks extending beyond this line indicates a significant region. X-axis indicates the GISTIC score scale. Genomic coordinates and the genes located within the 12q15 amplicon are shown below.

