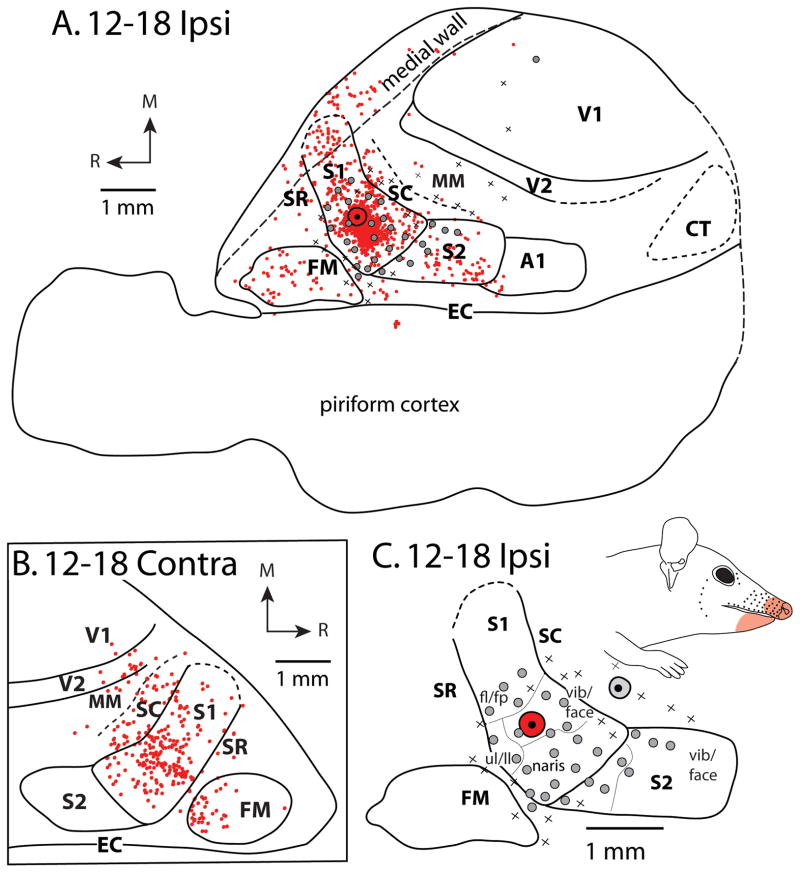
Figure 2.
Patterns of ipsilateral (A) and contralateral (B) cortical connections resulting from an injection of FR in the vibrissae/snout representation of S1 for case 12-18. Black dot and surrounding black disc (A, C) are the FR injection site and halo, respectively. (Black dot surrounded by gray disc in C is a separate injection – see Fig. 9C). In both A and B, red dots indicate individual cells labeled by the neuroanatomical tracer. Most ipsilateral connections are intrinsic to S1. Moderate label is also observed in ipsilateral S2 and FM, with weak label in SC and SR. In the contralateral hemisphere, homotopic locations within S1 are most densely labeled. Moderate contralateral connections are observed with SC, FM, and V2 and sparse connections are observed in SR, MM, and V1. For quantification of labeled cells in each cortical area, see Table 3 and Figure 5A. Details of neuroanatomical tracers used and injection parameters are found in Table 2. In this case, electrophysiological recordings (A, C) were performed to confirm the placement of the tracer injection. Grey dots indicate recording sites at which neurons responded to somatosensory stimulation while Xs indicate sites at which no clear response was elicited. (C) Expanded view of injection site and electrophysiological map from A, showing different body part representations (separated by thin lines), and the receptive field location (light red shaded region on face) of neurons at sites surrounding the injection site. Solid lines mark cortical field boundaries determined from the entire series of myelin stained sections. Medial (M) and rostral (R) directions are indicated by arrows. Other conventions as in the previous figure.

