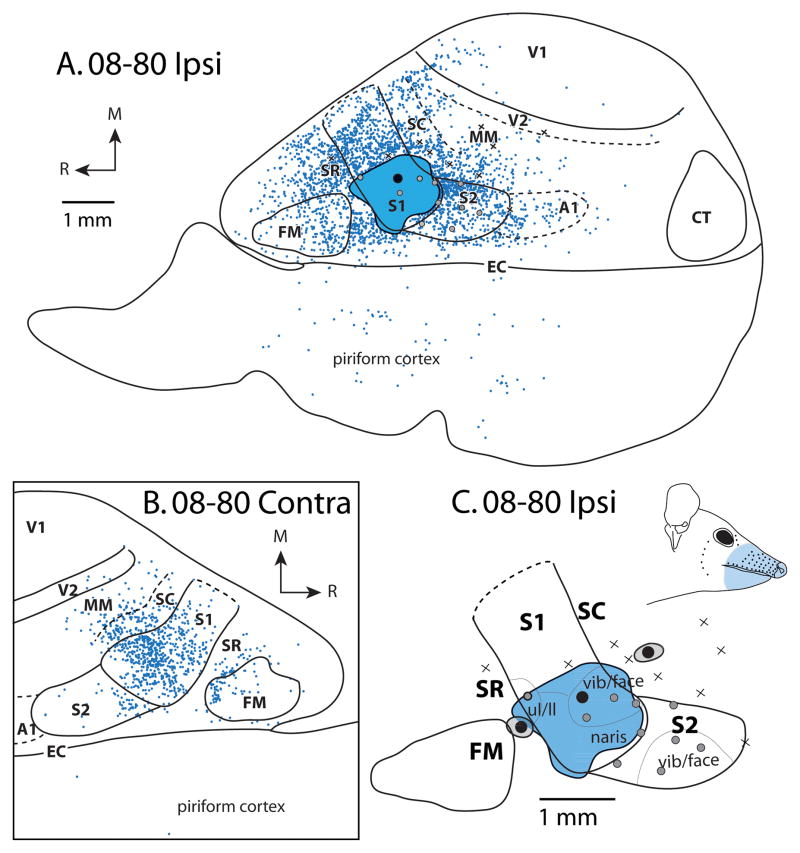
Figure 4.
Patterns of ipsilateral (A) and contralateral (B) cortical connections resulting from a large injection of BDA in the vibrissae/face representation of S1 for case 08-80. This injection spread slightly into SR and SC. In both A and B, blue dots indicate individual labeled cells. Most ipsilateral connections are intrinsic to S1. Strong label is observed in S2. Moderate label is observed in FM, SC, SR, and MM. Homotopic locations within S1 in the contralateral hemisphere are most densely labeled; dense label is also observed in SC and moderate label is in SR, S2, MM and FM. In this case, electrophysiological recordings were performed to confirm the placement of the tracer injection. (C) Expanded view of electrophysiological map from A. Black dots surrounded by gray disk represent separate injections (see Fig. 6 and Fig. 9A, 9B). Conventions as in previous figures.

