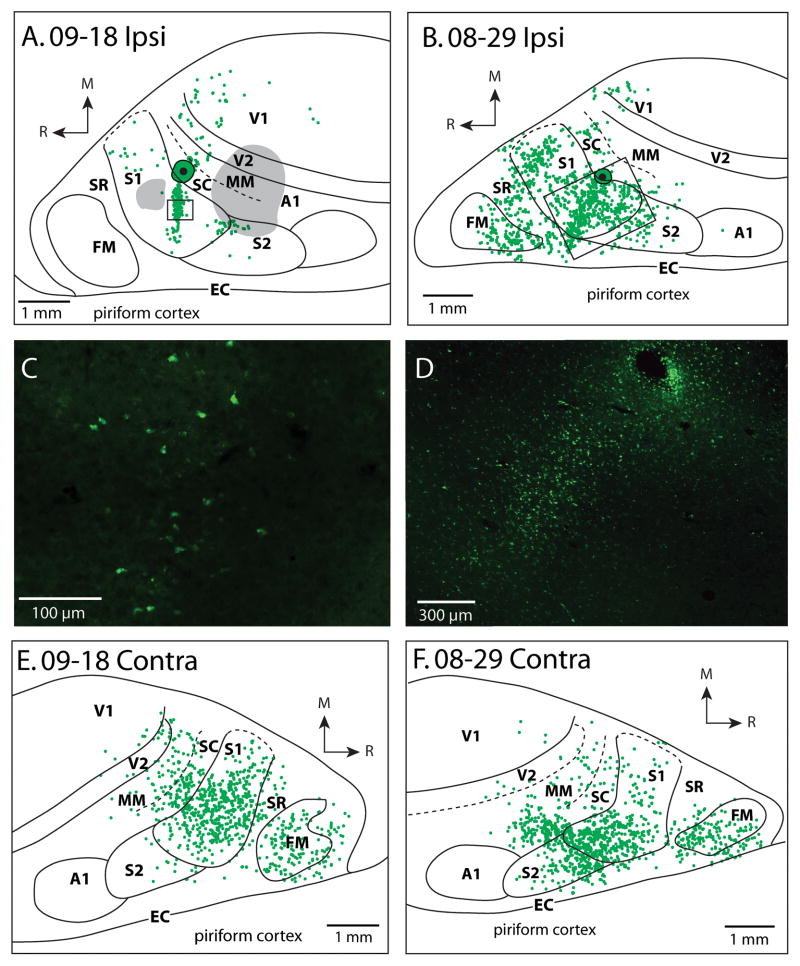
Figure 8.
Patterns of ipsilateral (A, B) and contralateral (D, E) cortical connections resulting from an injection of FE into SC in cases 09-18 and 08-29. Green dots indicate individual cells labeled by the neuroanatomical tracer. In A, gray areas are regions of cortex with superficial cortical damage. In both (A) and (B), black boxes show areas from which pictures were taken in (C) and (D). In the case without cortical damage (B), most of the labeled cells were observed in S1, with strong label also in SR and FM and moderate label in S2 and SC. Weak label was observed in V1. In the contralateral hemispheres (E, F), dense label was observed in S1, SC and FM and moderate label was observed in S2 and MM, and weak label was observed in SR and V2. Conventions as in previous figures.

