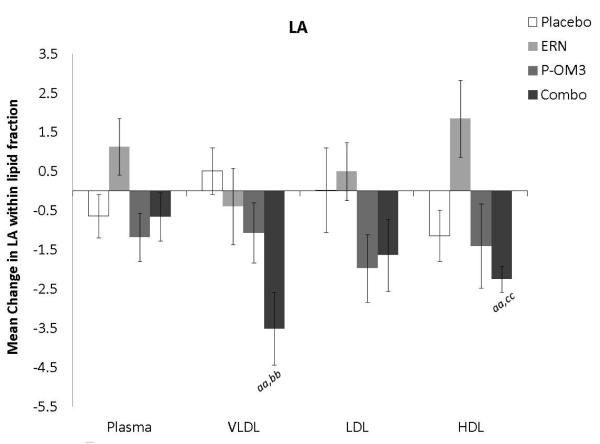
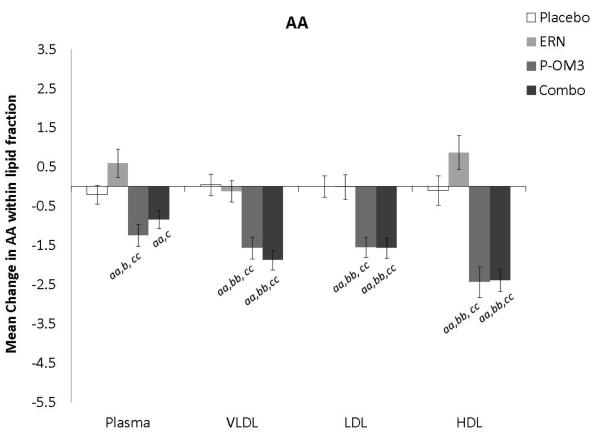
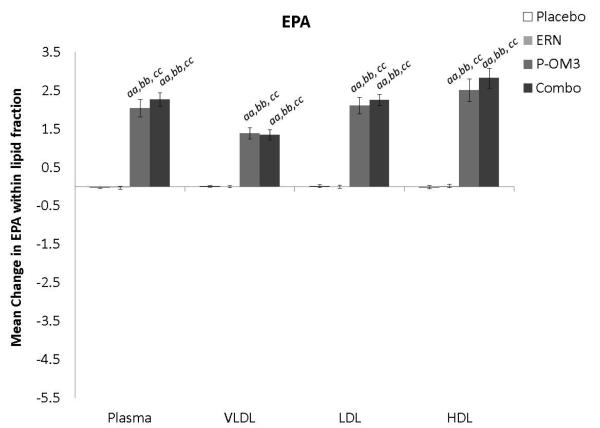
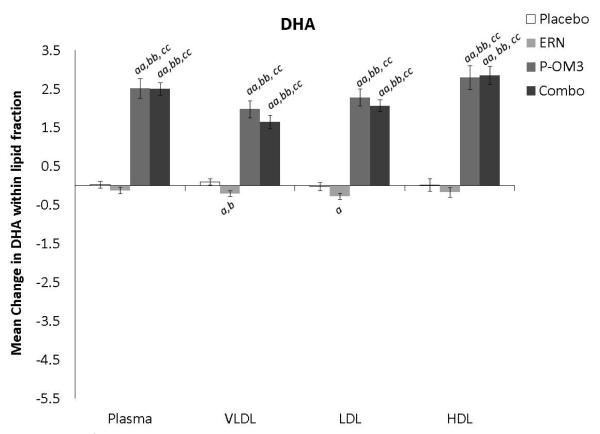
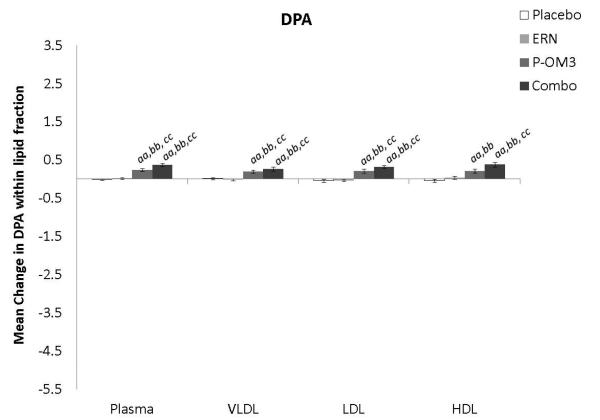
Figure 1. Mean change in fatty acid proportion within individual lipid fractions from baseline to follow-up in response to treatment.
ap<0.05; aap<0.01, treatment effect from baseline to follow-up visit; bp<0.05; bbp<0.01, treatment effect compared to change in placebo group; ccp<0.01, treatment effect compared to change in ERN group; LA, linoleic acid; AA, arachidonic acid; EPA, eicosapentaenoic acid; DPA, docosapentaenoic acid; DHA, docosahexaenoic acid.

