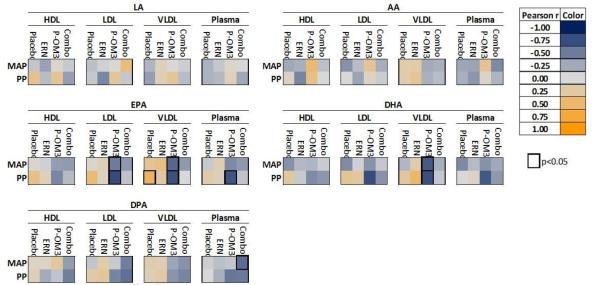
Figure 3. Heat map representation of correlation between change in percent fatty acid composition and vascular endpoints.
Each colored square represents the Pearson correlation between change in percent fatty acid within a specific fraction and change in vascular endpoint from baseline to follow-up. Significant associations (p<0.05) are highlighted by a thick black border. LA, linoleic acid; AA, arachidonic acid; EPA, eicosapentaenoic acid; DPA, docosapentaenoic acid; DHA, docosahexaenoic acid;MAP, mean arterial pressure; PP, pulse pressure.

