Fig. 4.

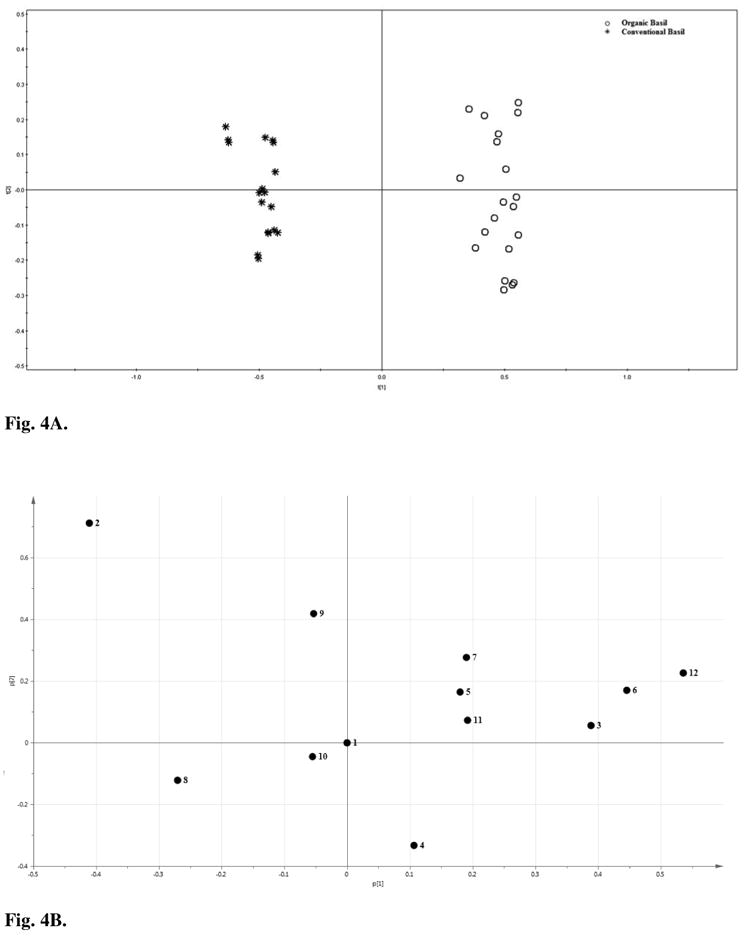
Principal component analysis (PCA) A) scores plot and B) loading plot for relative peak areas in HPLC fingerprints of organic and conventional sweet basil leaf samples. All peak areas were divided by the area of the peak 1 in the same spectrum, and the resulted relative peak areas were used for PCA.
