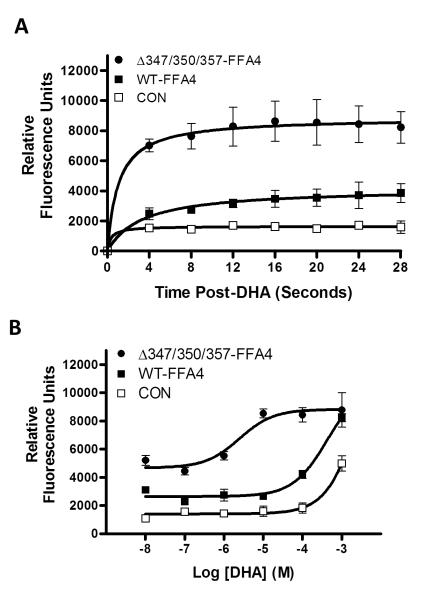
FIGURE 5. Effects of phosphodefective FFA4 on intracellular Ca+2 signaling.
(A) Intracellular Ca+2 was measured by Fluo-4NW fluorescence for 4 seconds prior to addition of DHA (100 μM) and then for 28 seconds in control HEK293 cells as well as those expressing WT-FFA4 or the T347A/S350A/S357A triple mutant (ΔT347A/S350A/S357A). One-way ANOVA analysis revealed significant differences in the mean s of the three groups (p < 0.0001) with post-hoc Tukey’s comparison revealing p < 0.01 for the CON versus WT-FFA4 response, p < 0.001 for WT-FFA4 versus ΔT347A/S350A/S357A response, and p < 0.001 for CON versus ΔT347A/S350A/S357A response. Due to inter -experimental differences in control values in the FLUO-4NW assay, which can affect experimental RFUs, data from two independent experiments with similar control values were pooled. Experiments were conducted at least four times. (B) DHA-dose response reveals leftward shift in the dose-response of ΔT347A/S350A/S357A (pEC50 = −5.6 ± 0.3) compared to WT-FFA4 (−3.7 ± 0.2), while the Emax is reached at nearly two-log units sooner in ΔT347A/S350A/S357A (ca. 10 .M) compared to WT (ca. 1 mM). Results represent pooled data from three independent experiments with similar control values.

