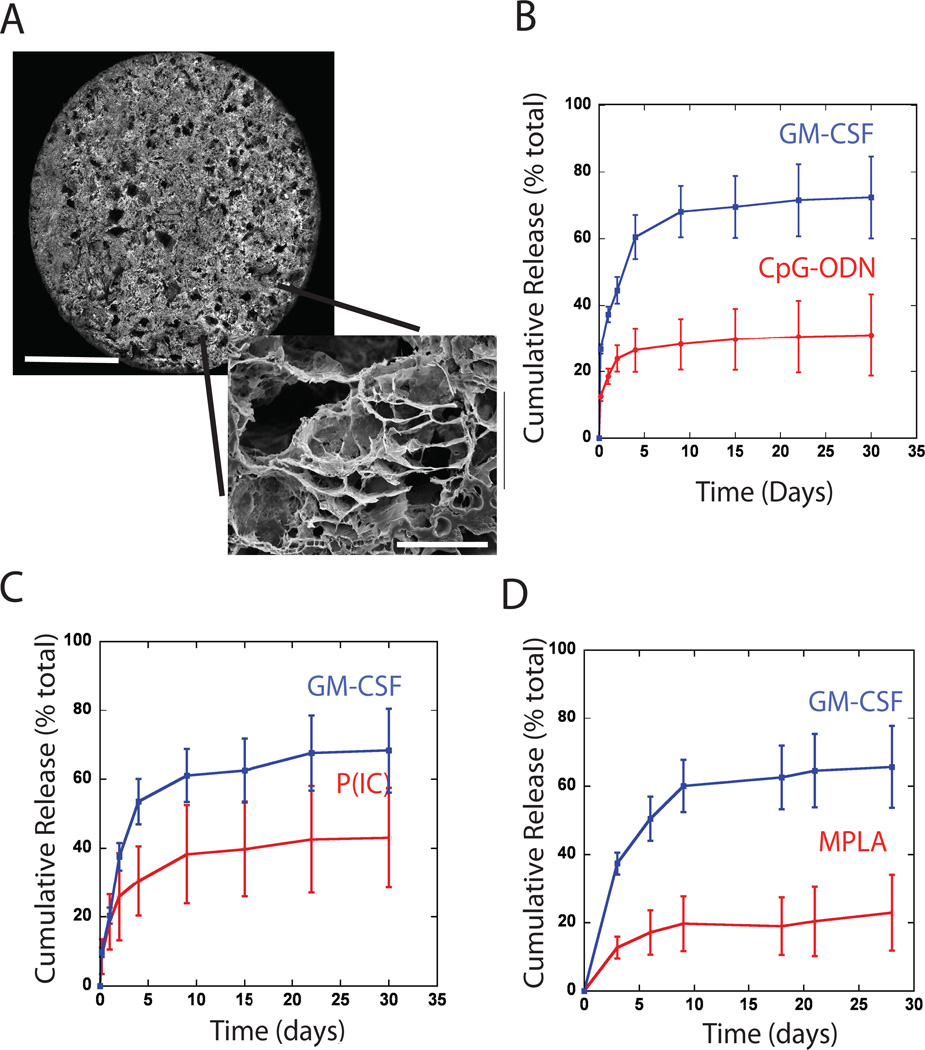
Figure #1. SEM of scaffolds, and in vitro release kinetics of various TLR agonists from GM-CSF loaded PLG scaffolds.
(A) Photomicrographs of top surface of macroporous PLG scaffold (scale bar – 3mm), and SEM micrograph of a scaffold cross-section (scale bar – 50µm). Cumulative release of (B) CpG-rich oligonucleotides (CpG 1826), (C) P(I:C) or (D) MPLA in combination with the cumulative release of GM-CSF from each of the PLG scaffold types. Values represent mean and standard deviation (n=5 or 6).

