
Figure 1.
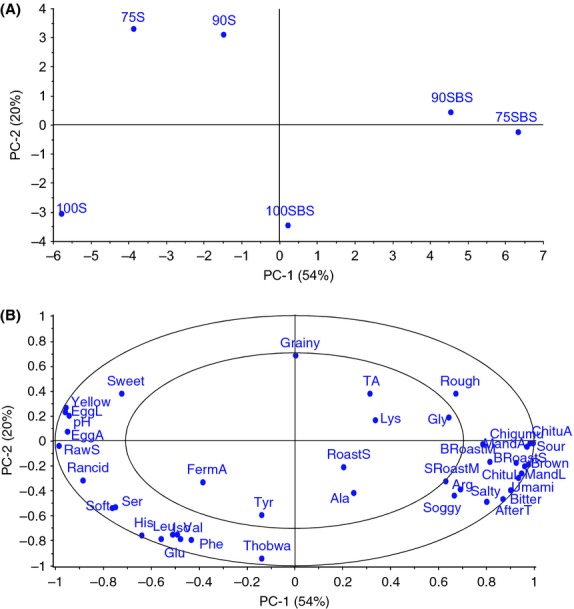
Principal component analysis of fermented pastes and sensory attributes. (A) Score plot showing relatedness of samples in terms of sensory, chemical, and physical properties of the pastes. (B) Correlations loading plot showing sensory properties of the pastes. On the map, 100S, 90S, and 75S represent naturally fermented pastes (NFP) while 100SBS, 90SBS, and 75SBS represent lactic acid-fermented pastes (LFP). Pastes are designated according to 100%, 90%, and 75% soybean composition, the remaining proportions being maize.