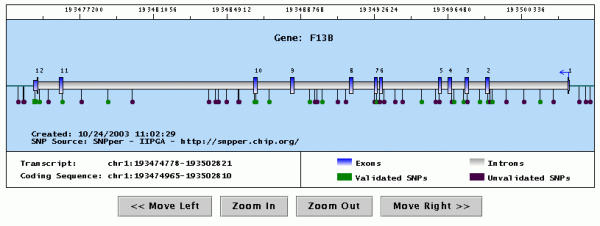
Figure 3.

Graphical representation of a gene with the SNPs it contains. The picture shows the output of a Java applet displaying the gene structure (exons are in blue, introns in gray) and all SNPs in the same region (represented by dots or squares). The user may scroll or zoom the display using the supplied buttons, or recenter the display by clicking on the top portion of the picture. Clicking on a SNP opens a pop-up window containing information about it.
