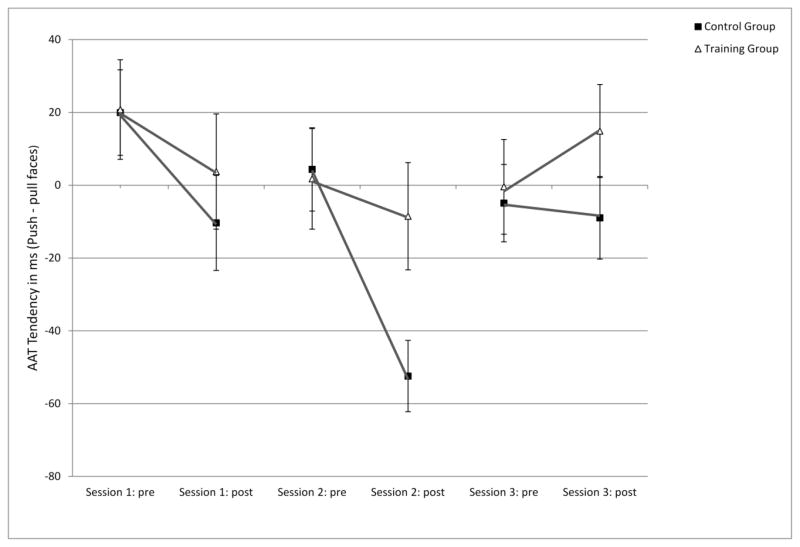
Figure 1.
Mean approach-avoidance index at pre- and post-assessment points for all three sessions.
Note. The figure shows mean approach tendency (reaction times for pulling faces subtracted from reaction times for pushing faces) at each of the pre- and post-test time points in each experimental sitting. AAT: Approach-Avoidance Task; Sessions 1–3: each experimental sitting; Pre: pre-test assessment of tendency in the session; Post: post-test assessment of tendency in the session.

