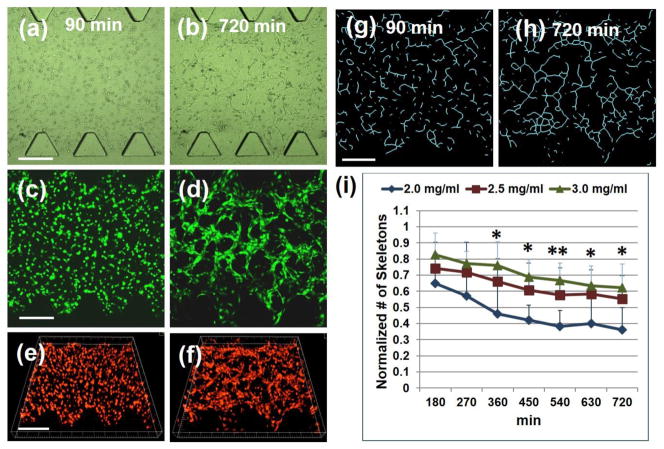
FIGURE 2.
Microvasculogenic behaviors within 3D CGSs (2.5 mg/ml) from 90 min to 720 min after initial seeding of HUVECs. (a)–(b) Phase contrast microscopic images at 90 min and 720 min (c)–(d) Fluorescence detection images using confocal microscope at 90 min and 720 min. (e)–(f) Confocal microscopic images processed using IMARIS 6.4 software at 90 min and 720 min. (g)–(h) Representative skeletonized images at 90 min and 720 min. (i) Kinetics of microvasculogenic behaviors within 3D CGSs from 90 min to 720 min. Collagen concentrations were 2.0 mg/ml (CGS1), 2.5 mg/ml (CGS2), and 3.0 mg/ml (CGS3), respectively. Quantitative analysis was conducted by examining skeleton formation from MIP images at the indicated time points. Comparative data among CGSs are plotted as the normalized skeleton numbers from eight to ten images within five different devices at three different times (N = 3). The normalized value is defined as the value divided by the maximum value for any given data set. Results were compared using the Student’s t test. Data are plotted as mean ± SD (* p < 0.05; ** p < 0.009), vs. skeleton count in CGS2 or CGS3. The maximum value of skeletons for the normalization procedure was 404. Scale bar, 300 μm.

