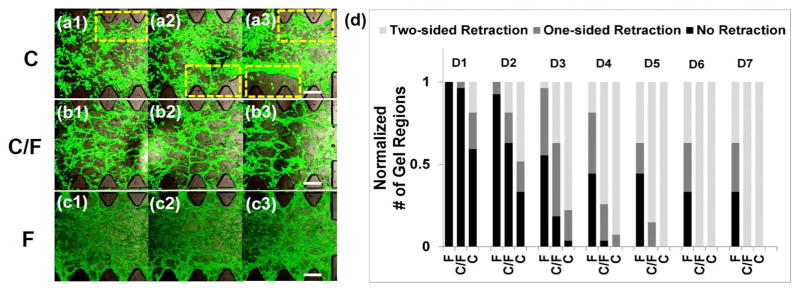
FIGURE 3.

Evaluation of spontaneous retraction of microvascular networks formation. Live confocal images of microvascular networks within GS1 [(a1)–(a3)], GS2 [(b1)–(b3)], and GS3 [(c1)–(c3)] at day 2. The GSs composed of collagen (2.5 mg/ml), collagen mixed with fibrin (1:1), and fibrin (2.5 mg/ml) are designated as C, C/F, and F, respectively. Retraction areas are indicated by dashed yellow lines. Scale bars, 300 μm. (d) Comparative scoring for spontaneous retractions within GS1, GS2, and GS3 from days 1 (D1)–7 (D7). X axis represents three different GSs with two-sided retraction, one-sided retraction, and/or no retraction and Y axis represents the normalized number of total gel regions within GSs from days 1–7. The normalized number of total gel regions was obtained by normalizing the number of gel regions that either had two-sided retraction, one-sided retraction or no retraction against the summation of these three numbers for each GS composition. The summation of total gel regions for each GS composition is 27. Retraction is defined as the areas with a retraction distance >250 μm from the border between the channel and the GSs. The grades for the degree of retraction are: 0 = two-sided retraction, 0.5 = one-sided retraction, and 1 = no retraction. Results in 6 devices at 3 times (N = 3) are compared.
