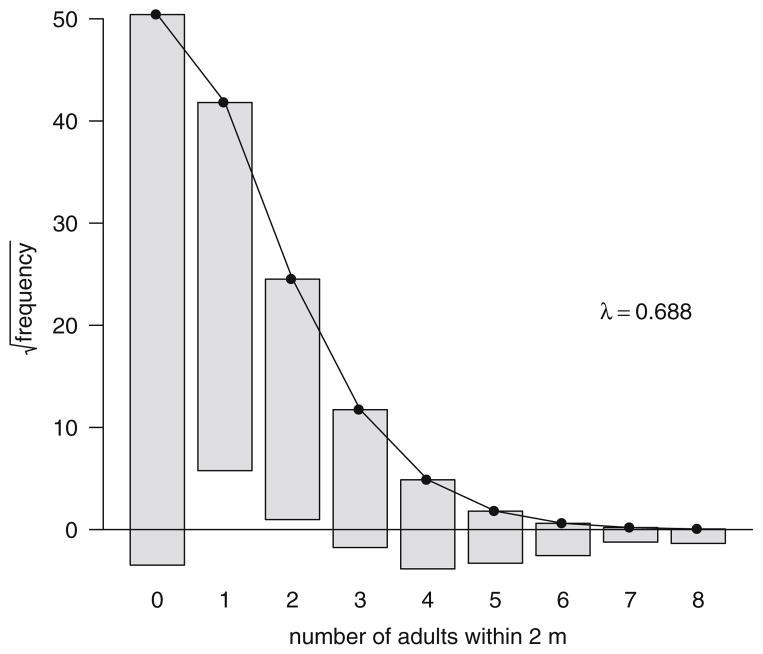
Fig. 1.
A “rootogram” of the raw proximity data frequencies as grey bars (Wainer, 1974) for Cayo Santiago, PR rhesus macaques (Macaca mulatta). Expected frequencies if the counts conformed to a Poisson distribution with the same rate parameter (λ) are shown with the black line and dots. Bars for the observed frequencies are shifted up or down to match the Poisson line, making their overlap with the horizontal axis a simple check on whether the frequency is greater or less than expected. There is an excess at counts ≥3 and at 0, and deficiency at counts 1 and 2.

