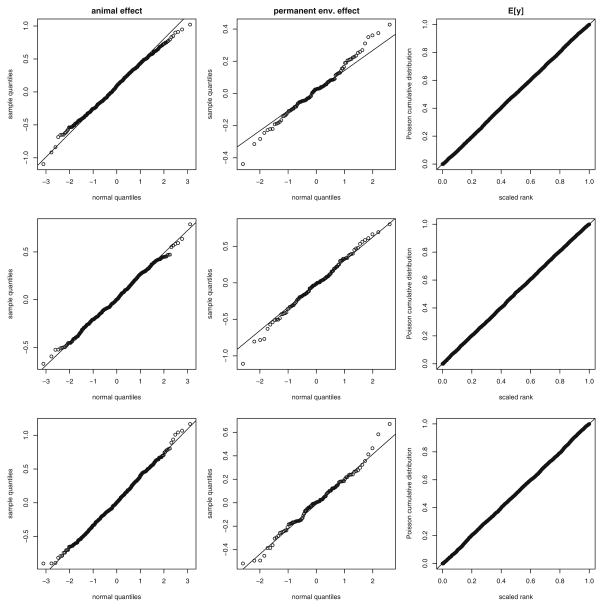
Fig. 4.
Diagnostic q–q and p–p plots from the full heritability model for Cayo Santiago, PR rhesus macaques (Macaca mulatta). Each row shows a single randomly selected MCMC sample. Each column displays q–q plots for the animal additive genetic effects, q–q plots for the permanent environment effect, and p–p plots for the predicted Poisson counts (Elston et al. 2001). In each plot, points are expected to fall along the diagonal line. Departures would indicate a poor fit of the Poisson log-normal GLMM. Deviation in these plots and those for other samples are quite small.

