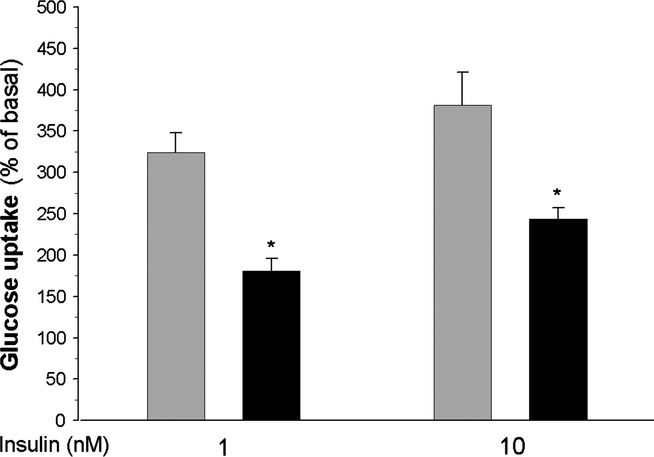
Figure 2.

Glucose transport in the adipocytes of control (grey bars) and diabetic (black bars) rats. Values represent means ± SEM of 12 determinations from three separate experiments. Basal glucose uptake was taken as 100%. *-differences statistically significant between the cells of control and diabetic rats, P < 0.05.
