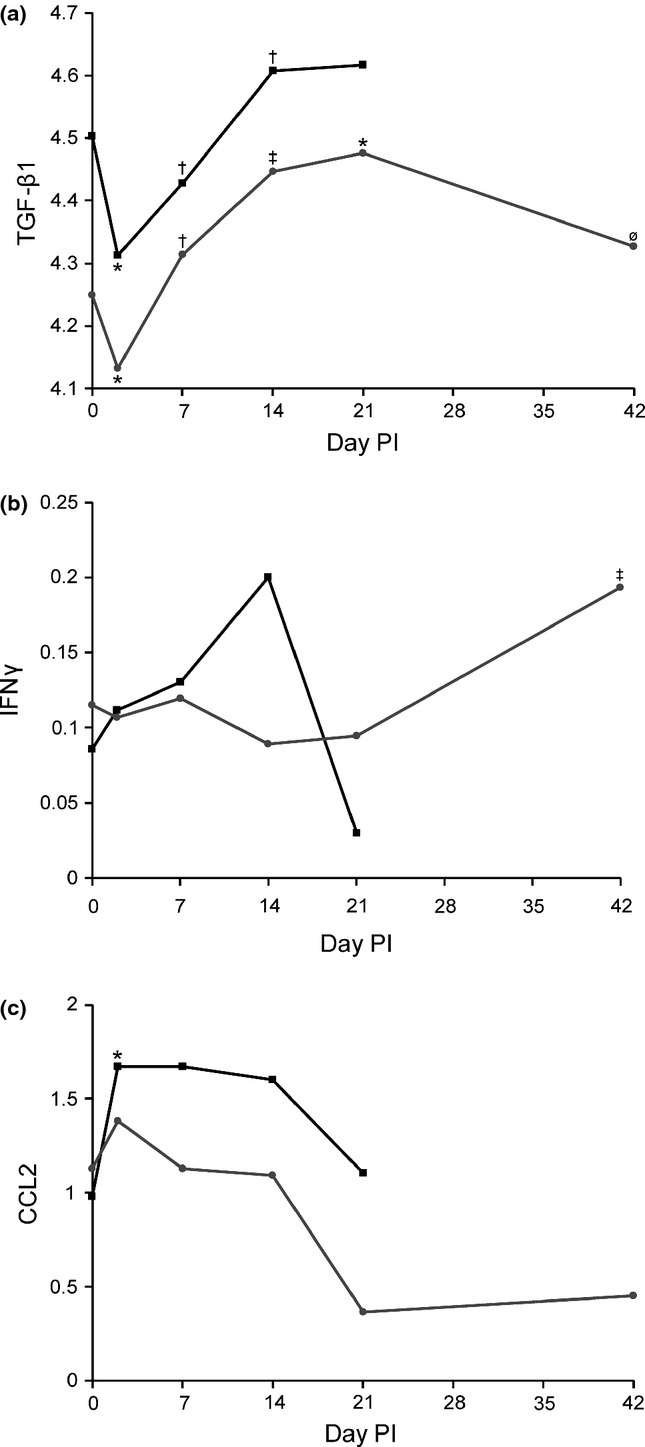
Figure 7.

Cytokine production in goats infected with B. pseudomallei. Responses of (a) TGF-β1 (log pg/ml), (b) IFNγ (log ng/ml) and (c) CCL2 (log ng/ml) in aerosol ( ) and percutaneous (
 ) groups. Significant elevations were only present for CCL2 in aerosol-infected goats and IFNγ in percutaneously infected goats. TGF-β1 shows an initial decrease followed by increases through day 21 before returning to pre-infection levels on day 42. (‡) Different than previous measure and pre-infection, (†) different than previous measure but no different than pre-infection, (*) different than pre-infection, (ø) not different than previous measure or pre-infection, significance P < 0.05.
