
Table 2.
Results of the FP competitive binding assay for a set of representative fragments. (See Supporting Information, Table S1 for the full set of inactive fragments). Reported FP values are the average of triplicate measurements ± SEM. NT = not tested.
| Compound | Scaffold | R1 | R2 | R3 | R4 | FP EC50 (μM) | FP Ki (μM) | BEIa | LEIb | CC50 (μM)c |
|---|---|---|---|---|---|---|---|---|---|---|
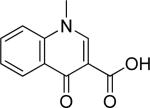
| 20 |
|
>250 | NT | |||||||
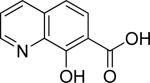
| 21 |
|
>250 | NT | |||||||
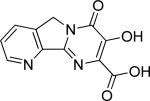
| 22 |

|
>250 | NT | |||||||
| 23 |
|
67.4 ± 2.4 | 21.6 ± 1.1 | 19.0 | 0.36 | NT | ||||
| 24 |

|

|
H | OH | OH | 58.9 ± 0.5 | 18.7 ± 0.2 | 16.3 | 0.31 | NT |
| 25 |
|
H | OH | OH | 18.09 ±0.04 | 5.01 ± 0.02 | 22.4 | 0.43 | NT | |
| 26 | H | OH | OMe | 71.3 ± 0.6 | 20.3 ± 0.2 | 18.8 | 0.39 | NT | ||
| 27 |
|
H | OH | OH | 5.92 ± 0.05 | 1.84 ± 0.01 | 24.6 | 0.47 | NT | |
| 28 | H | OH | OMe | 156.1 ± 1.9 | 50.42 ± 0.59 | 17.4 | 0.33 | NT | ||
| 29 | CH3 | OH | OH | 151.8 ± 1.5 | 49.0 ± 0.7 | 17.4 | 0.34 | NT | ||
| 30 |
|
H | OH | OH | 119.7 ± 1.5 | 38.6 ± 0.6 | 17.9 | 0.34 | NT | |
| 31 |

|
H | OH | OH | 3.8 ± 0.3 | 1.1 ± 0.1 | 25.4 | 0.48 | >60 | |
| 32 | H | OH | OMe | 25.46 ± 0.15 | 8.00 ± 0.09 | 20.6 | 0.39 | NT |