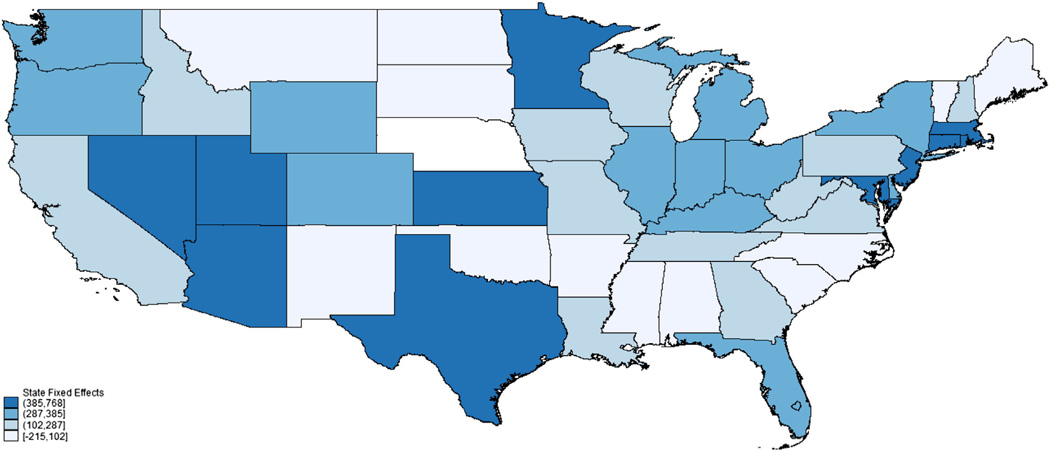
Appendix Fig. 19.
State fixed effects from multivariate regression including socio-demographic, economic, political, policy variables of 2 year-olds. Shown in the figure are the state fixed effects categorized into quartiles above and below the median state. Darker blue denotes higher state fixed effects and lighter blue and white denote lower state fixed effect values. While it appears that the north east and some of the West and Southwest have higher state fixed effects and that the South has lower state fixed effects, there are notable exceptions in all of these regions. To make the map more readable, Hawaii and Alaska are not shown. The values of the state fixed effects for Hawaii is $217 and for Alaska is $219.

