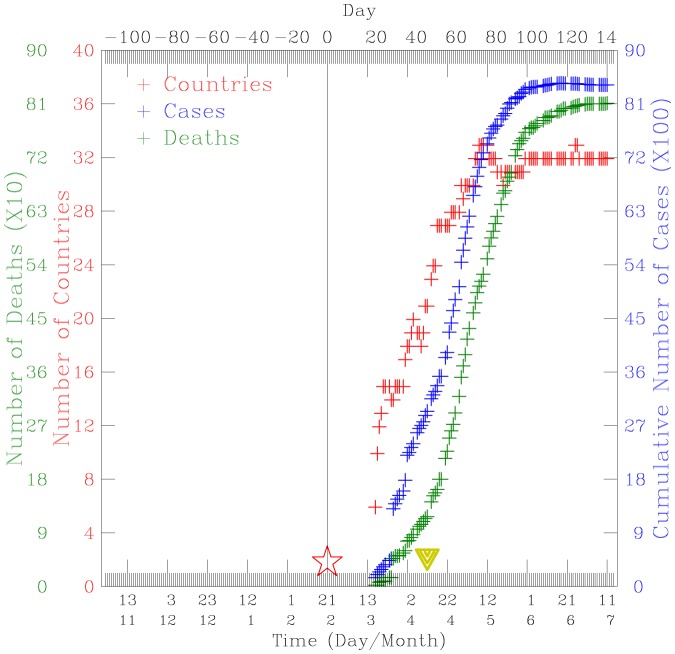
Figure 1. Time-series plot of the accumulated number of countries with reported SARS cases (red crosses), daily global reported cases (blue crosses), and deaths (green crosses) during the period 1 November 2002–15 July 2013.
The red open star indicates the arrival of the 64-year-old nephrologist in Hong Kong on 21 February 2003. The inverted green triangle indicates the day when the first SARS coronavirus was sequenced. Data are compiled from the World Health Organization (www.who.int/csr/sars/country/en/, accessed 3 December 2013).

