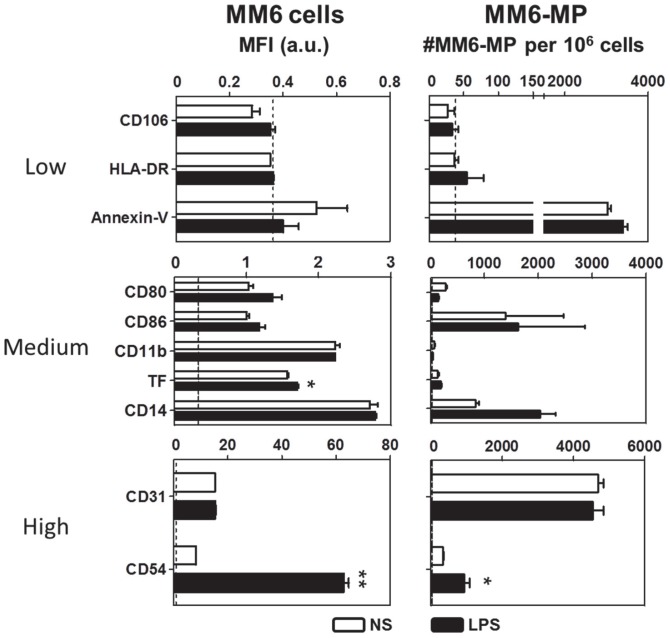
Figure 2. Monocyte and mMP surface antigen phenotype.
Both unstimulated and LPS-stimulated MM6 were stained with anti-CD106, HLA-DR, CD80, CD86, CD11b, TF, CD14, CD31, CD54 mAb and annexin-V. The mean fluorescence intensity was measured and compared to isotype-matched controls (left column). mMP were also stained for the same surface antigens to check inheritance from the parent cell. Positively stained MP were counted and expressed as the number of MP per 106 monocytes (right column). Monocytes with MFI between 0–1, 1–5, and above 10 were considered as low expressors (top panel), medium expressors (middle panel) and high expressors (bottom panel) respectively. Experiments were performed at least 3 times in duplicates. Data are expressed as mean ± SD. *p<0.05, **p<0.01.

