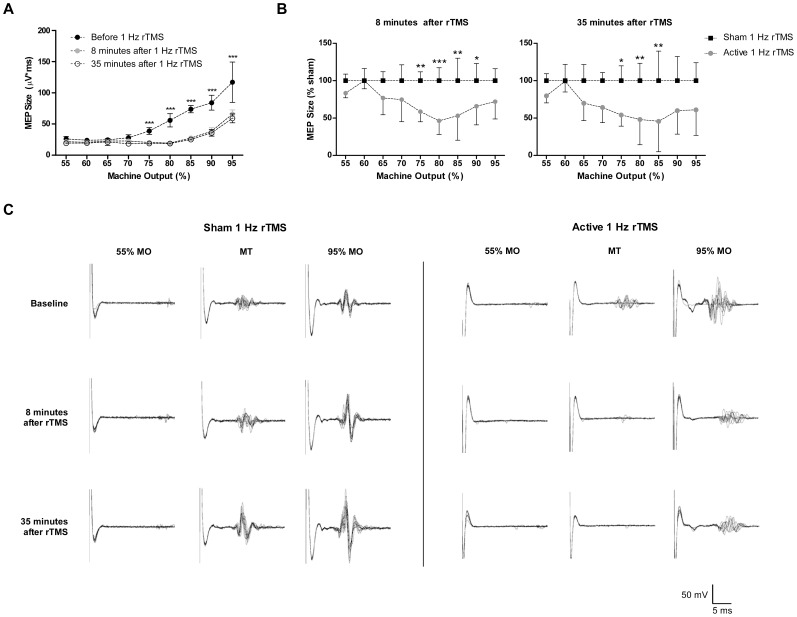
Figure 2.
(A) Representative recruitment curves. Averaged integrated voltage (uV*s) for the baseline recruitment acquisition from all animals is compared to post-stimulation values at both the 8 and 35-minutes timepoints after rTMS. By 2-way ANOVA, there is a significant reduction in the integrated MEP size following 1 Hz stimulation at both 8-minutes [stimulation effect: F(1,162) = 294.3, p<0.0001; MO effect: F(8,162) = 127.5, p<0.0001; interaction effect: F(8,162) = 25.86, p<0.0001] and the 35-minutes [stimulation effect: F(1,162) = 355.6, p<0.0001; MO effect: F(8,162) = 118.2, p<0.0001; interaction effect: F(8,162) = 27.23, p<0.0001] timepoints. Significance is confirmed by post-hoc t-test from 75–95% MO. Error bars indicate SD. ***p<0.001. (B) MEP changes following 1 Hz rTMS. All values are normalized to sham rTMS control. The difference between active and sham rTMS recruitment curves is significant by 2-way ANOVA at the 8-minute [stimulation effect: F(1,90) = 28.35, p<0.0001] and 35-minutes [stimulation effect: F(1,90) = 30.29, p<0.0001] timepoints. At individual stimulator intensities, using post-hoc t-test, there is a significant suppression at 75, 80, 85 and 90% MO (p<0.01, p<0.001, p<0.01, p<0.05, respectively) at the 8-minutes timepoint, and significant suppression at 75, 80 and 85% MO (p<0.05, p<0.01, p<0.01) at the 35-minutes timepoint. Error bars indicate SD. *p<0.05; **p<0.01; ***p<0.001. (C) Representative MEPs following 1 Hz active or sham rTMS. Ten consecutive MEP sweeps at 55% MO, 100% MT, and 95% MO from one animal per condition, active or sham rTMS, are shown. Baseline traces are followed by MEPs generated at the same MO at the 8-minutes and 35-minutes timepoints.

