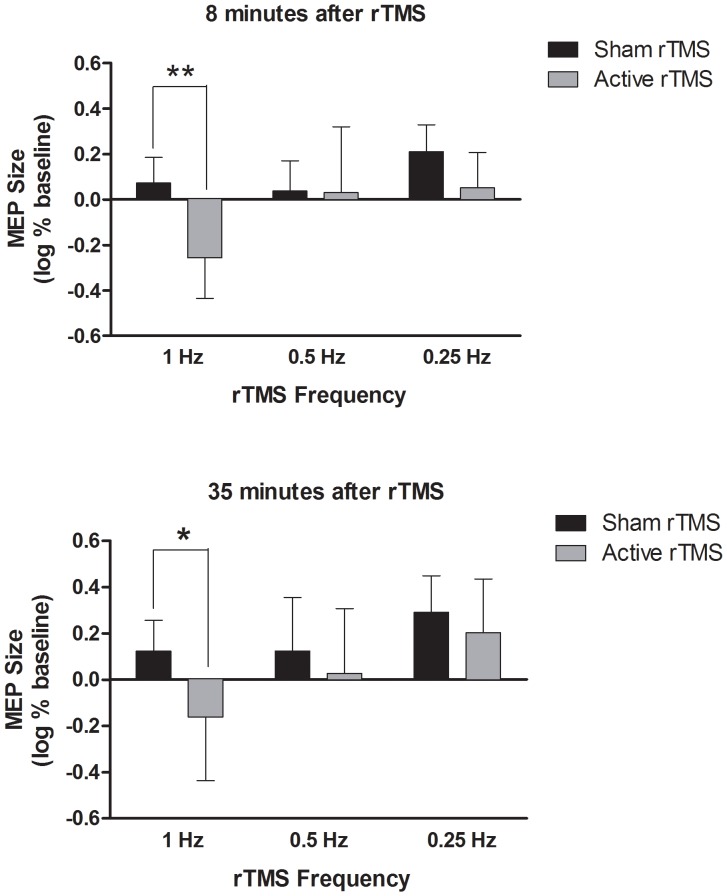
Figure 3. MEP change as a function of rTMS frequency.
All conditions are shown at 80% MO. All ratios of average MEP integrated voltage relative to pre-rTMS baseline were log transformed. Compared to its baseline, 1 Hz active rTMS is the only condition where the MEP size was suppressed at both the 8-minues (p<0.01) and 35-minutes (p<0.05) timepoints. Error bars indicate SD. *p<0.05, **p<0.01.

