
Figure 1. Examples of flight paths of two individual bees.
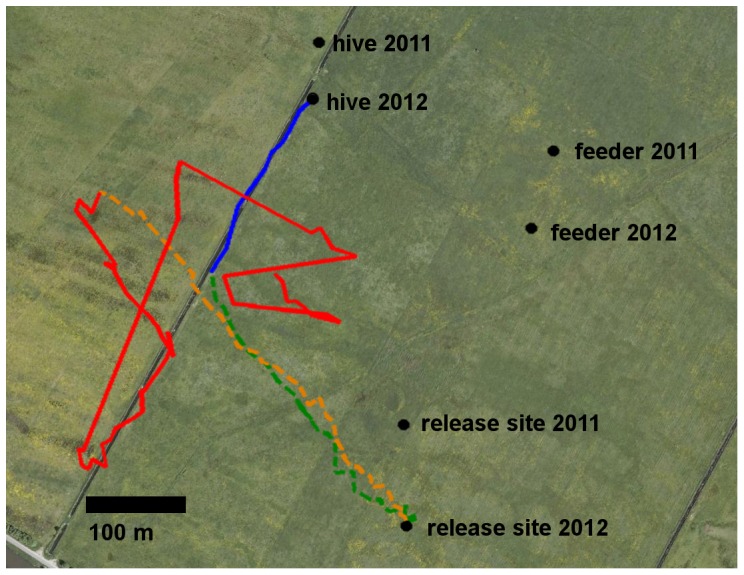
The dashed lines (green, yellow) depict the vector flight component and the blue and red lines the homing flight component. The green and blue traces come from a control bee, the yellow and red traces from a bee treated with thiacloprid. The initial flight path from the release site towards west-northwest (dashed lines) is called the vector flight because it predominantly resembles the flight vector the animals would have taken if they had not been transported to the release site (catch-and-release design of experiment). The following flight path (full lines) is called the homing phase since in most animals the flight ended at the hive. If an animal did not reach the hive (as in this case after thiacloprid treatment) the homing phase was analyzed until the animals were not seen any more at the radar screen. Both bees were released at the same release site (release site 2012) and both bees showed a similar flight vector at first. Notice that the locations of the hives, the feeding sites and the release sites differed somewhat in the two experimental seasons (2010, 2011). The map was created using Google Earth (Google Inc. 2012). A scale bar is shown for 100 meter.