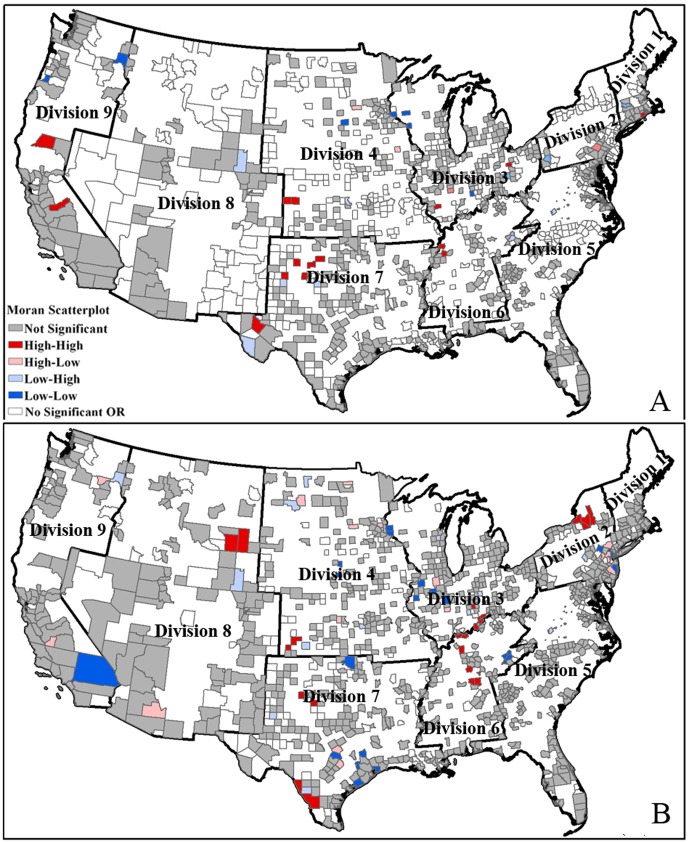
Figure 4. Clusters for benzene pollution exposure by age at county level.
A local autocorrelation method is used to identify statistically significant hot spots, or cluster areas. High-High areas indicate high values near high values; Low-Low areas indicate low values near low values; High-Low areas indicate high values near low values; Low-High areas indicate low values near high values. (A) age (<14); (B) age (>60). Division 1 is New England; Division 2 is Mid-Atlantic; Division 3 is East North Central; Division 4 is West North Central; Division 5 is South Atlantic; Division 6 is East South Central; Division 7 is West South Central; Division 8 is Mountain; Division 9 is Pacific.

