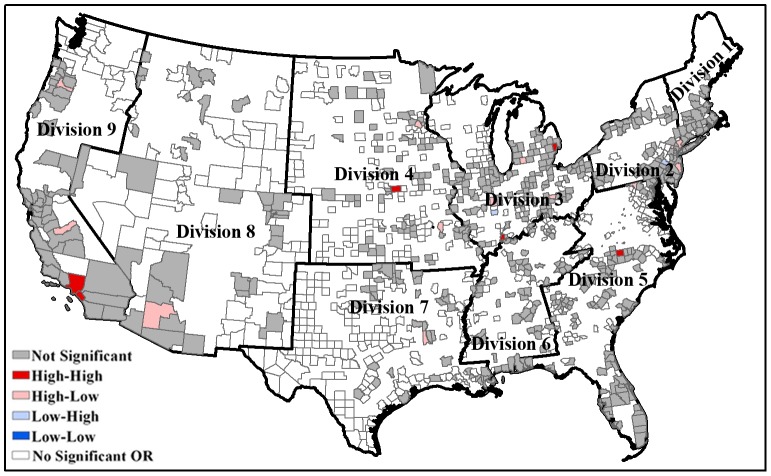
Figure 7. Clusters for benzene pollution exposure by income at county level.
Fig. 7 shows High-High areas are high values cluster areas, in which people with low income exposed to higher level of benzene pollution than those with high income. Division 1 is New England; Division 2 is Mid-Atlantic; Division 3 is East North Central; Division 4 is West North Central; Division 5 is South Atlantic; Division 6 is East South Central; Division 7 is West South Central; Division 8 is Mountain; Division 9 is Pacific.

