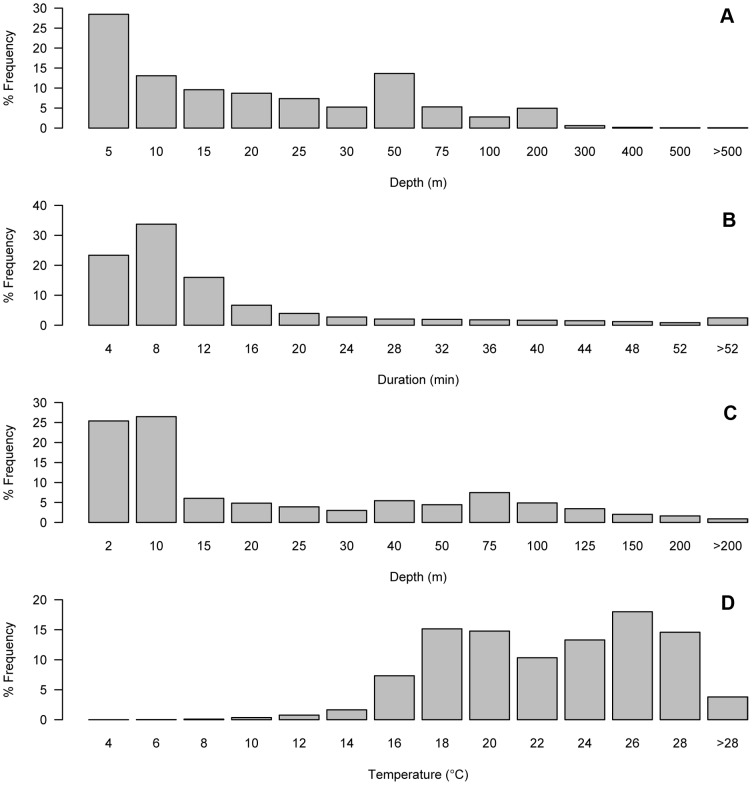
Figure 3. Frequency distributions of dive parameters from satellite tags on leatherback turtles in the North Atlantic Ocean.
a) Dive-depth (n = 19) and b) dive-duration (n = 17) from turtles tagged 2007–2009. c) Time-at-depth (n = 15) and d) time-at-temperature (n = 15) from turtles tagged from 2008–2009.

