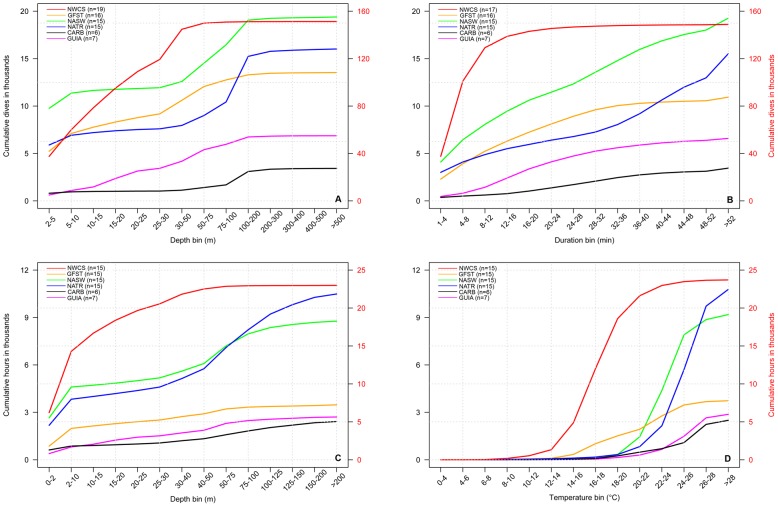
Figure 6. Cumulative frequency plots of leatherback dives in Longhurst regions of the North Atlantic Ocean.
Depth and duration bins (top panels) and leatherback hours in depth and temperature bins (bottom panels). NWCS, Northwest Atlantic Shelves; GFST, Gulf Stream; NASW, North Atlantic Subtropical Gyral West; NATR, North Atlantic Tropical Gyral; CARB, Caribbean; GUIA, Guianas Coastal. The second y-axis (red) corresponds to NWCS (red line) while all other regions reference the first y-axis (black). This highlights the increased dive activity of tagged turtles in the NWCS region.

