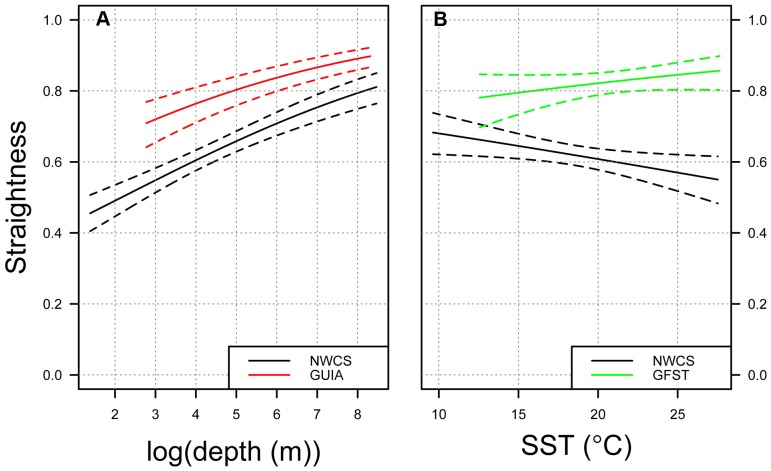
Figure 7. Predicted straightness (solid lines) and 95% confidence intervals (dashed lines) from the best performing model in Table 4.
Leatherback path straightness is shown in relation to: a) observed log-transformed bathymetry (m) in each of two distinct ecoregions of the northwest Atlantic and b) observed sea surface temperature (SST) in each of two distinct ecoregions of the northwest Atlantic; Northwest Atlantic Shelves (NWCS); Gulf Stream (GFST); Guianas Coastal (GUIA). Mean SST value in each region was used to create the bathymetry plot and mean bathymetry value in each region was used to create the SST plot.

