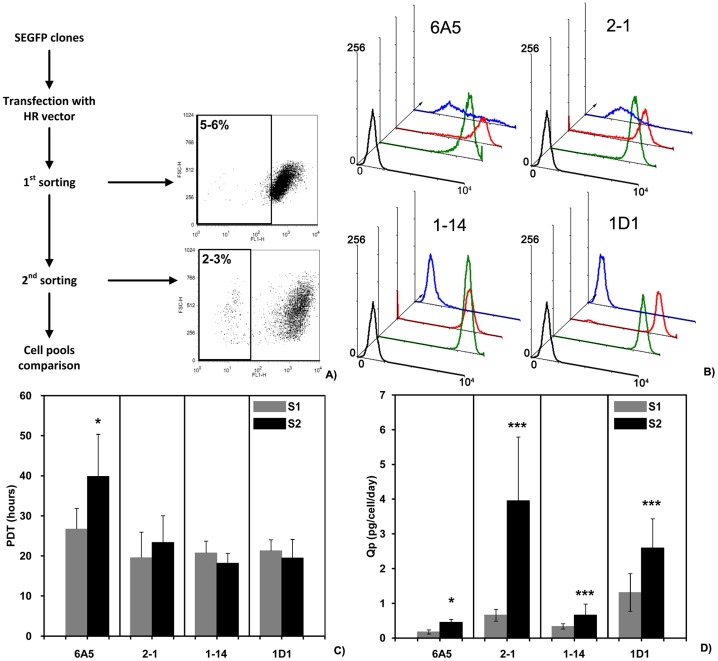
Figure 4. SEGFP-negative cells sorted by FACS and analysis of sorted cell pools.
(A) An overview of sorting SEGFP-negative cells. After transfection with HR plasmid C, the four SEGFP cell clones were sorted by FACS twice. The FACS profiles showed the sorting cell population and the percentage was the sorting ratio in different sorting steps. (B) The sorted cell pools were analyzed and compared with the corresponding SEGFP cell clones. Using CHO cells (blank line) as a control, FACS profiles showed the fluorescence signals from SEGFP cell clones (green line) compared with those of the cell pools from the first (red line) and second (blue line) rounds of cell sorting. Although SEGFP-negative cells were only collected from 1D1 and 1–14 cell clones, the cell size and the protein content of all four sorted cell pools (-S2) did not change from that of each parental cell line (Supplemental Figure 1). (C, D) The cell growth of sorted cell pools remained consistent according to comparison of PDTs. However, TNFR-Fc expression was increased in every sorted cell pool following the sorting process.

