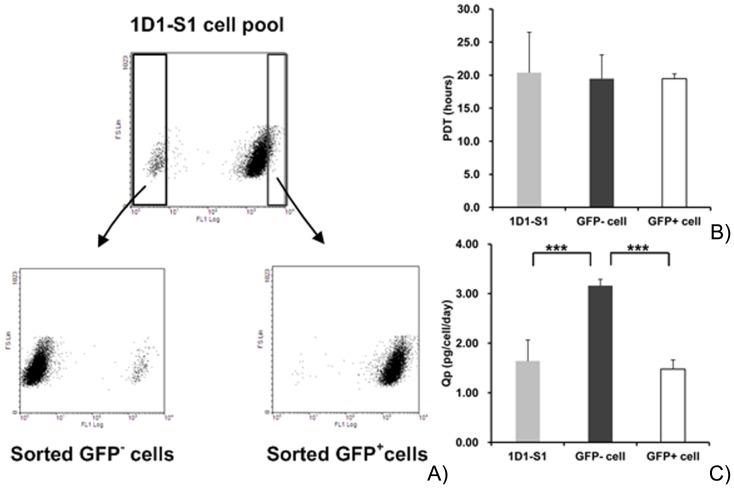
Figure 6. Comparison of site-specific and random integration.
(A) Enrichment process of site-integration cells (GFP− cells) and random-integration cells (GFP+ cells). The dot plot shows the two subpopulations sorted from the 1D1-S1 cell pool. (B, C) PDT and Qp of TNFR-Fc were compared between the subpopulations. The 1D1-S1 cell pool was used as a control.

