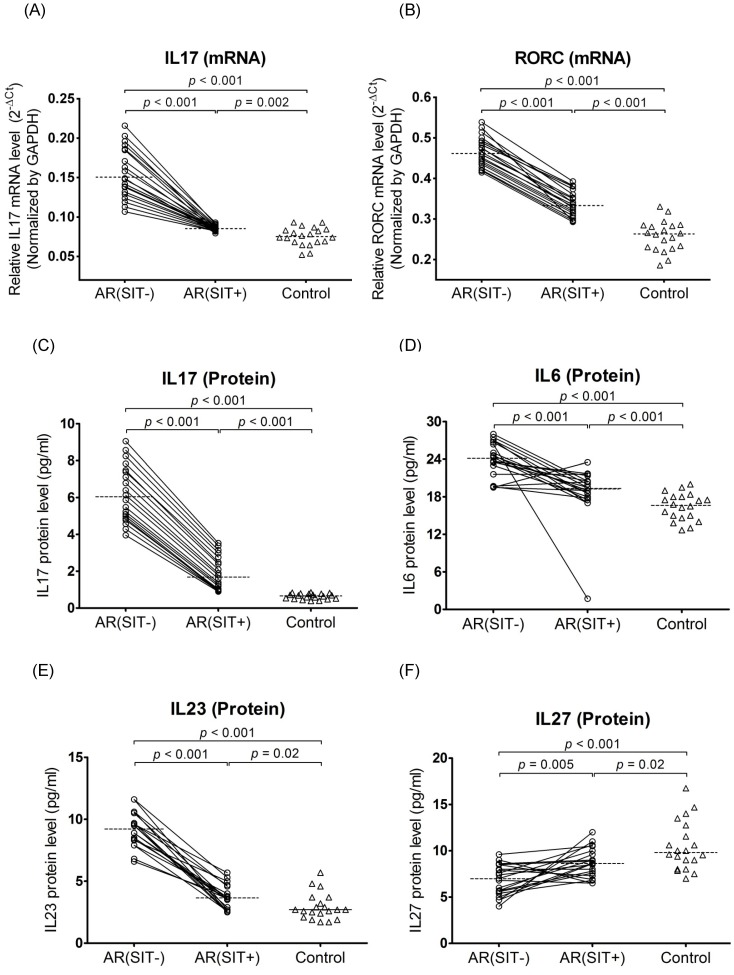
Figure 2. Quantitative determination of mRNA by real-time RT PCR for IL17 (A) and RORC (B) in PBMCs and evaluation of protein production by ELISA for IL17 (C), IL6 (D), IL23 (E), and IL27 (F) in plasma.
The samples were collected from AR patients (open circles) and the controls (open triangles). Connecting lines indicates data obtained in the same subject before and after SIT treatment. Medians are shown by horizontal dashed lines. Statistical analyses were performed by Wilcoxon matched pairs sign rank test for paired comparison (SIT-untreated vs. SIT-treated patients); whileMann-Whitney two-tailed test for unpaired comparison (SIT-untreated or SIT-treated vs. control subjects).

