
Figure 2. Subsequent Memory Effects.
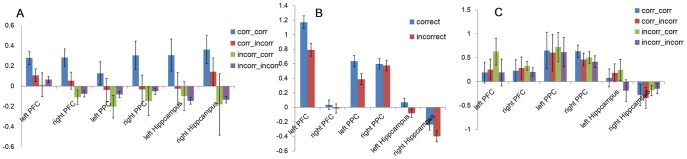
A. Parameter estimates (beta values) of ROIs for Test 1 trials as a function of accuracy on Test 1 (left term in legend) and Test 2 (right term in legend). B. Parameter estimates of ROIs for initial study phase as a function of accuracy on Test 1. C. Parameter estimates for ROIs in Re-study 1 (study following Test 1) as a function of accuracy on Test 1 (left term in X-axis labels) and Test 2 (right term in X-axis labels). Error bars are ±1 standard error.