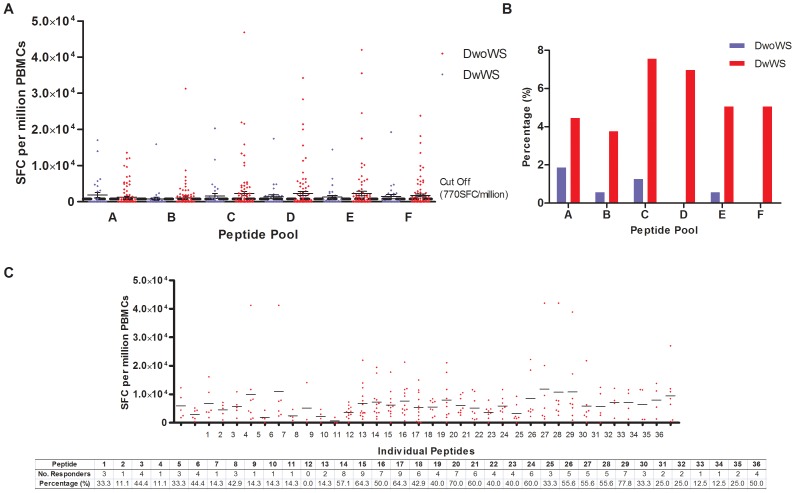
Figure 4. IFN-γ T cell responses in the study population.
(A) SFC per million PBMCs of patients with (red) and without (blue) warning signs in response to pooled peptide. The mean cutoff values after subtraction of healthy control is at 770SFC/million PBMCs. Mean ± SEM is given for every peptide pool. (B) Number of responders towards each peptide pool for patients with (red) and without (blue) warning signs is given in percentage. (C) SFC per million PBMCs of patients in response to individual peptides. The mean cutoff values after subtraction of healthy control is not given as it varied for every peptide. The mean response for each peptide is indicated in the mean line. Table below graph shows each individual peptide, and the number of responders towards these peptides.

