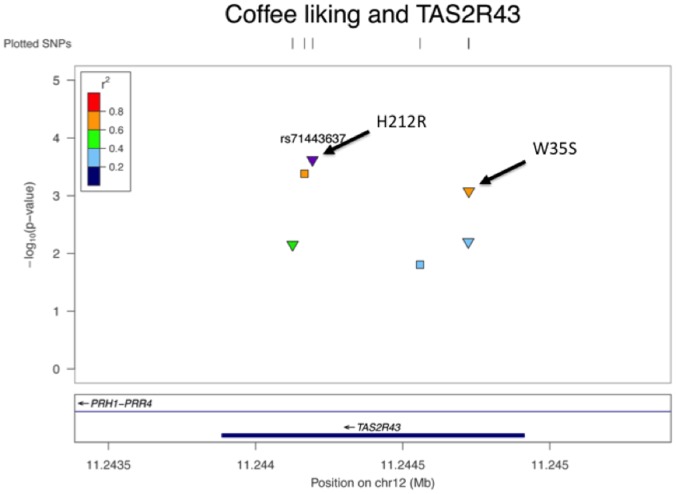
Figure 1. Regional plot of the association results in the TAS2R43 gene.
Triangles represent non-synonymous SNPs whereas squares represent synonymous SNPs.. The colors represent the LD between the SNPs and rs71443637 with respect to the 1000 Genomes CEU population. The violet point is the index SNP which the LD refers to. The plot was created with the LocusZoom software [40].

