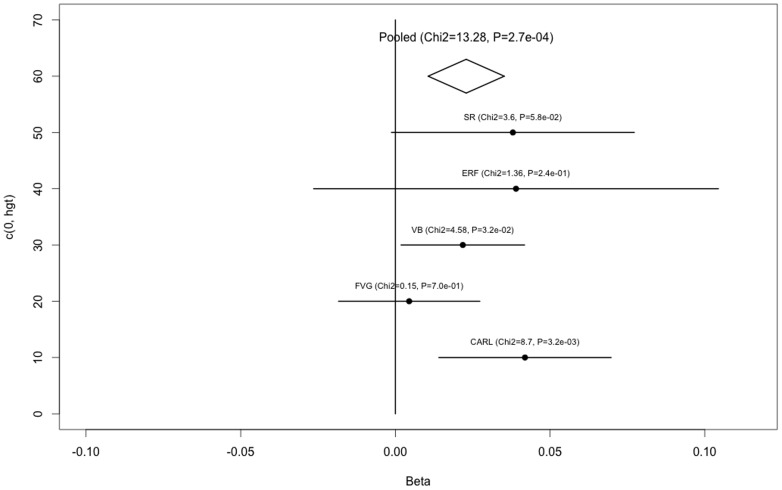
Figure 2. Forest plot of the normalized effect for the various populations for rs71443637.
Points represent the effect estimates and bars indicate is the 95% confidence interval. The diamond represents the pooled effect. For each population p-values are also shown. INGI-FVG clearly shows no effect of the SNP on coffee liking.

