
Figure 1. The effect of chloroquine and FTS treatments on autophagy.
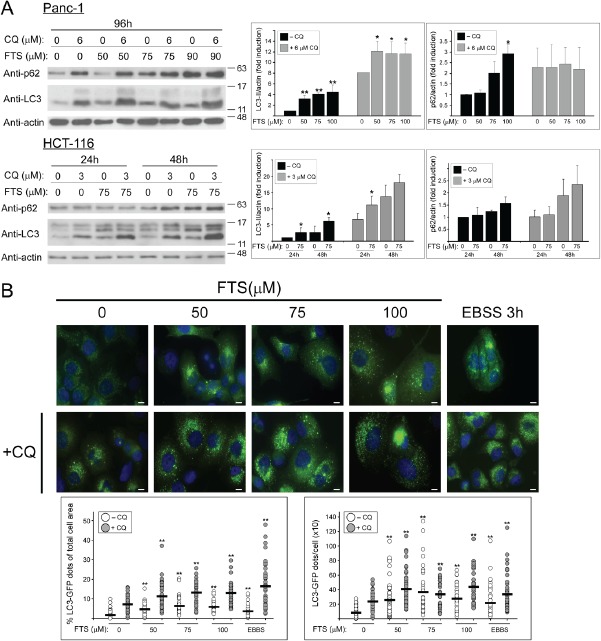
(A) Panc-1 and HCT-116 cells were treated with FTS at the indicated concentrations, with or without chloroquine (CQ, 3 and 6 µM) for the indicated times, and then subjected to immunoblot analysis using anti-LC3 and anti-p62 antibodies. Left panels, representative blots. Right panels, densitometric analysis of the results is presented as fold induction over the control untreated cells (means ± S.D, n=4; *, p < 0.05 and **, p<0.01). (B) Panc-1 cells stably expressing LC3-GFP were treated with or without 7.5 µM chloroquine in the absence or presence of FTS at the indicated concentrations, for 48 h. As a control, cells were incubated with EBSS for 3 h. The cells were fixed with 4% paraformaldehyde and nuclei were stained with bisdenzimide (Hoecsht 33258). Following fixation and staining, the cells were photographed using Olympus motorized inverted research microscope Model IX81 (60×magnifcation; scale bars, 10 micrometer). Upper panel, representative images are shown. Lower Panel, autophagy was quantified by calculating the percentage of LC3-GFP dots relative to the total cell area and by counting the number LC3 dots per cell using the ImageJ software. Each dot represents a single cell (horizontal black bar: average; 40-70 cells were analyzed per treatment; **, p < 0.01).