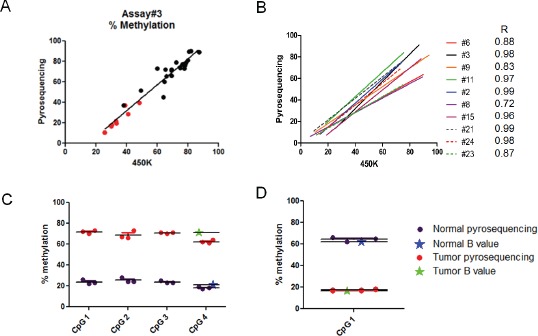
Figure 2. Verification of Infnium 450K results by pyrosequencing.

Twenty (20) tumor and 8 reduction mammoplasty samples were analyzed using pyrosequencing assays designed at 10 randomly chosen 450K CpG loci (Supplementary Table 1). The percent methylation determined by pyrosequencing was plotted against the β-value determined by Infinium 450K analysis multiplied by 100. A. Panel shows representative results (assay #3) for each of the tumor (black dots) and reduction mammoplasty (red dots) samples. B. Panel shows the correlation plots for each of the 10 assays with the Pearson's correlation indicated for each. Assays #6, #8, #9, and #15 were subsequently shown to map ambiguously (see M&M). C & D. Representative results comparing the β-value determined by 450K analysis at a single CpG locus (CpG4) with the methylation levels determined in the same two samples by pyrosequencing (points are triplicate assays). Note that adjacent (<200 bp in these assays) CpG dinucleotides show similar levels of methylation as the single CpG locus interrogated by the 450K probe. Panel C shows a locus that is hypermethylated in tumors compared to normal breast tissue. Panel D shows a locus that is hypomethylated in tumors compared to normal breast tissue.
